







- Of 966 CMBS modifications since January 2022, 210 included a paydown of at least 1% of the balance, totaling $2.0 billion, with a typical paydown of 5.4%.
- Twelve months out, 21% of paydown loans were in special servicing, delinquent or liquidated versus 40% of those without one, and the gap held at 24 months.
- A paydown looks like the strongest signal of a committed borrower, while higher reserves did not track with better outcomes, which matters for servicers weighing extensions.
Borrowers who wrote a check as part of a CMBS loan modification were roughly half as likely to end up in trouble later, a Trepp analysis finds.
Few do. Of 966 modified loans since early 2022, only about 1 in 5 included a paydown.
Get Smarter about what matters in CRE
Stay ahead of trends in commercial real estate with CRE Daily – the free newsletter delivering everything you need to start your day in just 5-minutes
Who Pays and How Much
Paydowns of at least 1% of balance showed up on 210 deals, totaling $2.0B. The typical one was 5.4%, though the top decile topped 18%. Borrowers funded nearly all of it, and only 23 were funded by selling off one property from a portfolio loan.
Special servicers pressed for them more often than master servicers, on 28% of deals versus 10%. Larger loans paid more, with single-asset deals at 32% against 19% for conduit loans, and loans over $100M at 27%.
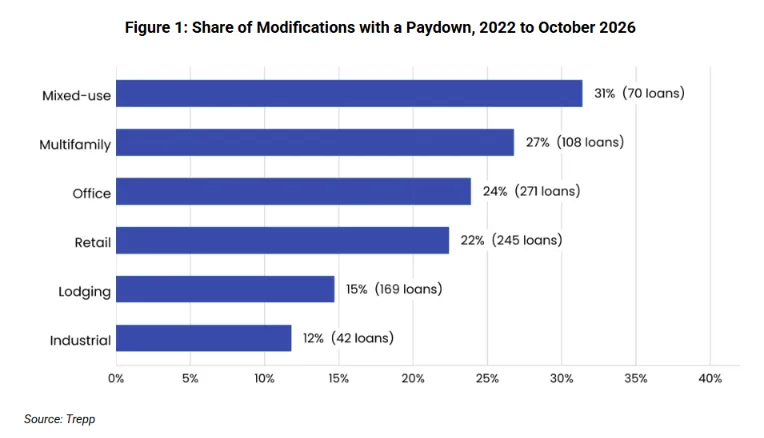
Property type mattered too. Mixed use topped the list at 31%, ahead of multifamily (27%) and office (24%), while hotels sat at 15% and industrial at 12%.
What a Paydown Buys
Extensions carry most of them: 31% included one, compared with 2% of forbearance deals. Payers still got no extra time, because both groups typically received 12 months.
A 2023 New York office workout shows the full package. The servicer gave roughly two more years in exchange for a $5M paydown and over $6M deposited into leasing and capital reserves.
Does It Help?
The firm tracked two years of special servicer modifications. After 12 months, 21% of paydown loans remained with the special servicer, were delinquent or had been liquidated, against 40% of loans without a paydown. By month 24 the split was 17% to 39%, and about half of payers (51%) had paid off versus 18%.
Payers started with stronger credit: a typical debt service coverage ratio of 1.69x versus 1.44x, and loan-to-value of 54% versus 59%. The edge held inside every coverage and leverage band, though. For borrowers with matching coverage and property type, 21% of payers struggled within a year, compared with 36% of non-payers.
Reserves Tell a Murkier Story
Reserves rose on 27% of modifications, adding $1.13B, typically 2.8% of the balance. Just 6% paired higher reserves with a paydown.
Loans with higher reserves fared worse than the rest, with 29% in trouble within a year versus 24%. Trepp says some of those reserves are just excess cash trapped and swept from the property, not new money from borrowers.
Why It Matters
Modified debt is now a big slice of the market. Our earlier look at CMBS modifications found servicers have reworked $98.3B since 2022, with a little over 21% of the remaining balance delinquent versus 4.7% for loans never modified.
Servicers are also running out of easy exits. Trepp’s data, covered in our report on failed workouts, showed foreclosure at 23% of special servicing exits while modifications fell to 37% from 54% in 2024.
What’s Next
Trepp calls paydowns the exception but the strongest signal in its data. Watch whether servicers lean harder on borrowers for cash as extensions get tougher to justify.