






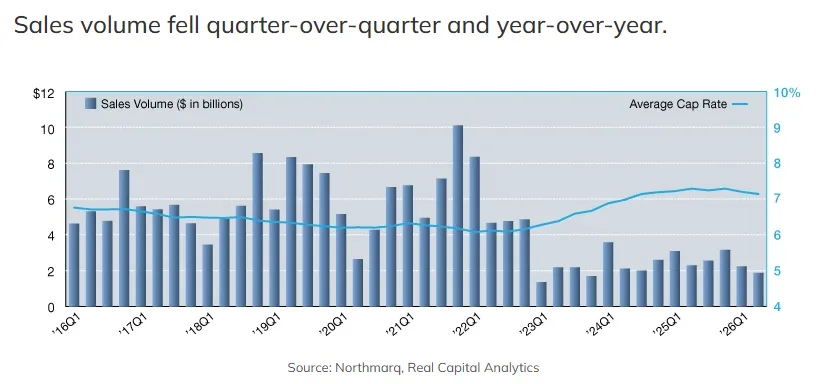
- Northmarq and Real Capital Analytics data show single-tenant office volume of $1.9B in Q2, down 16.5% from Q1 and 18.7% year over year, as cap rates slipped 6 basis points to 7.14%.
- The Southeast led with $522.6M, or 27.9% of volume, followed by the West at $474.2M and the Southwest at $426.2M, with cap rates from 6.72% (Southeast) to 7.83% (Midwest).
- Private buyers made up 56% of acquisitions and institutions 26%, while REIT buying rose to 7% from 4%, signaling a shift toward private capital as institutions step back.
Net lease office buyers pulled back in the second quarter, with single-tenant office sales volume falling to $1.9 billion, according to Northmarq and Real Capital Analytics data published by Commercial Property Executive.
That is down 16.5% from the first quarter and 18.7% from a year earlier. Cap rates dipped 6 basis points to 7.14%, 12 basis points lower than a year ago.
Get Smarter about what matters in CRE
Stay ahead of trends in commercial real estate with CRE Daily – the free newsletter delivering everything you need to start your day in just 5-minutes
Southeast Takes the Lead
The Southeast led deal flow with $522.6 million, or 27.9% of volume. The West followed at $474.2 million (25.3%), the Southwest at $426.2 million (22.8%) and the Midwest at $304.9 million (16.3%).
The Northeast added $104.1 million (5.6%) and the Mid-Atlantic only $41 million (2.2%). In the first quarter, the West and Mid-Atlantic had led.
Cap Rates Vary by Region
Regional cap rates ranged from 6.72% in the Southeast to 7.83% in the Midwest. Rates declined everywhere but the West and Southwest.
Even so, the average remains 106 basis points over its 6.08% trough from Q1 2022.
Private Money Returns
Through Q2, private buyers accounted for 56% of single-tenant office purchases, ahead of institutions at 26%. The institutional share slid 3 points from 2025 while private activity rose 2 points.
REIT and listed buyers rose to 7% of activity from 4% in 2025. In the Q1 report, institutions held 40% of purchases and REITs 10%, so the mix moved sharply between the two readings. First-quarter volume was $2.5 billion, with cap rates at 7.23%.
Why It Matters
Single-tenant office is trading at a slower pace, with cap rates edging lower. The shift toward private buyers fits a market where the best space is scarce, as Yardi Matrix’s pipeline data shows construction at 0.5% of stock.
Tenant-credit and lease length drive these deals, and Manhattan’s recovery, with leasing spreading beyond trophy buildings, shows demand is selective.
What’s Next
Q3 data will show whether volume stabilizes. Cap rates sit above their 2022 low, so pricing could be tested if borrowing costs keep climbing.