






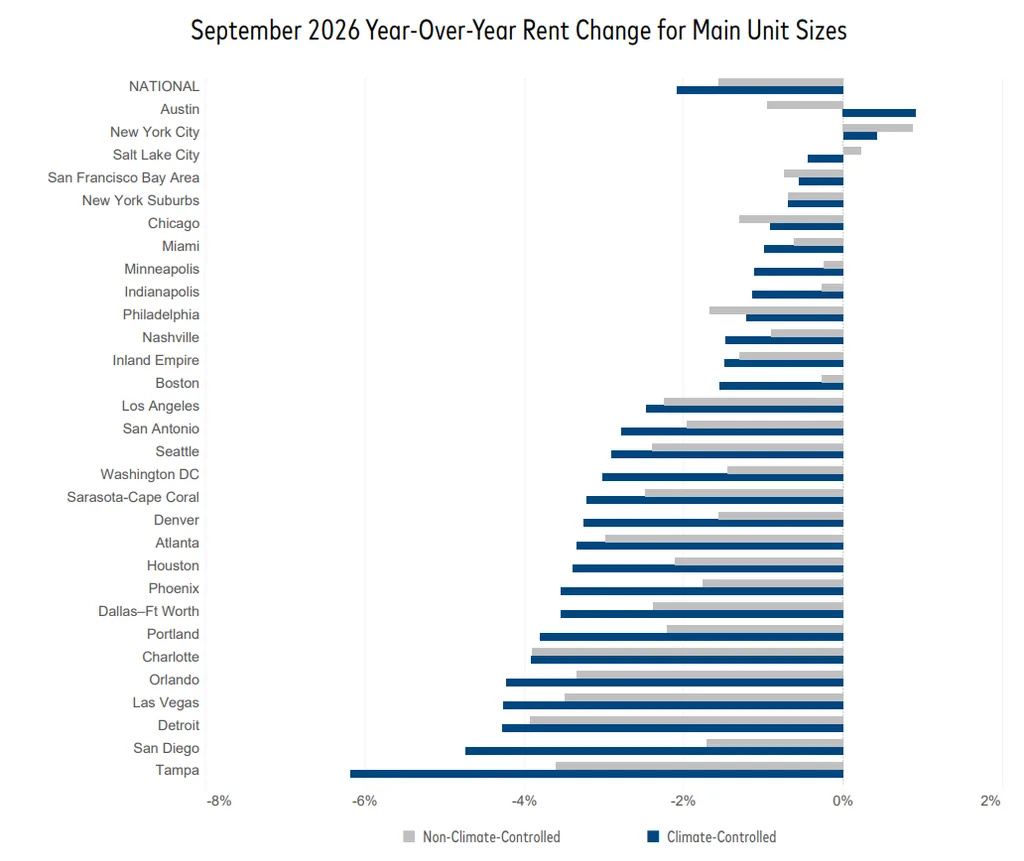
- Yardi Matrix reports national advertised self storage rates fell 1.8% year over year in September, with climate-controlled down 2.1% and non-climate-controlled down 1.6%.
- Under-construction supply is 2.1% of inventory and trailing-12-month deliveries equal 2.2%, but lease-ups are taking longer, and only Austin and New York City posted annual rate growth.
- New CMBS-loan occupancy data show 85.3% in June, 670 basis points below the REIT same-store figure, and REITs are cutting rates 3.3% versus 1.0% for non-REITs.
Self storage is building less, but self storage rates are still falling, according to Yardi Matrix’s October 2026 national report.
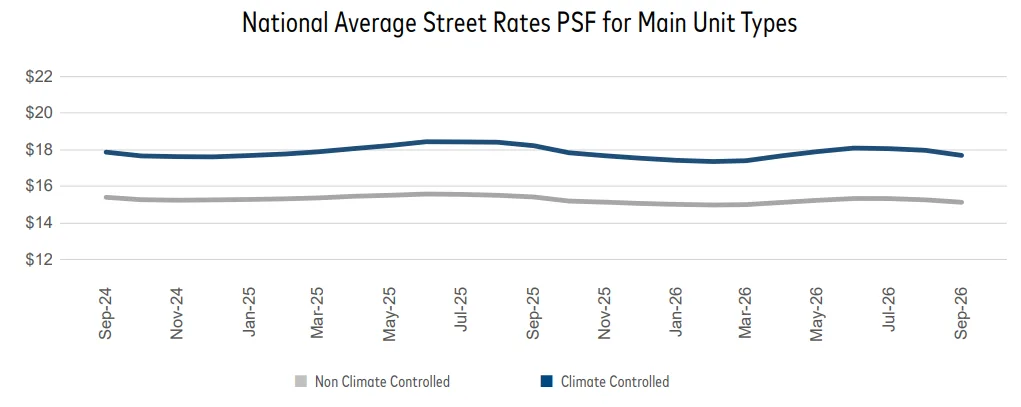
Nationally, September’s advertised rates were 1.8% below a year earlier; the gap was 1.9% in August and 1.6% in July.
Get Smarter about what matters in CRE
Stay ahead of trends in commercial real estate with CRE Daily – the free newsletter delivering everything you need to start your day in just 5-minutes
Rates Slide Across Unit Types
Climate-controlled rates dropped 2.1% and non-climate-controlled rates fell 1.6%. Yardi sees no improvement in rent growth since the sharp slowdown early this year.
Annual gains were rare: just New York City and Salt Lake City for non-climate-controlled units, and only Austin and New York City for climate-controlled ones.
REITs Cut Harder
Public storage REITs are discounting faster than everyone else. Their asking rates were down 3.3% from a year earlier in September, versus 1.0% for non-REIT operators, and fell 2.4% from August. Because REIT revenue-management software reacts to demand as it happens, Yardi reads the deeper cuts as a possible sign of weaker recent demand.
Sequentially, national rates fell 1.2% in September to $16.21 per square foot, the biggest monthly drop since a 1.7% decline in October 2025. All 30 top metros slipped, led by Austin (down 2.5%) and Denver (down 2.3%).
New CMBS Occupancy Data
Yardi has added occupancy figures for stores backing CMBS loans: 85.3% in June, which is 670 basis points under what REITs reported for their same-store pools at the end of Q2. The West was highest among regions at 87.6%, and the South lowest at 82.9%.
Washington, D.C., posted the highest June occupancy, 90.3%, among markets with 10 or more reporting stores. Tampa (80.6%), Las Vegas (83%) and Phoenix (84.4%) showed the effect of new supply, with year-over-year drops of 60, 220 and 460 basis points.
Lower-income areas lagged, with the bottom income quartile averaging 83.7% versus 86.5% in the top quartile. REIT-owned stores in the pool averaged 90.8% versus 86.3% for third-party managed stores. Stores in areas with more than 14 square feet of storage per person averaged 82.5%, versus 88.3% where supply is below 6.8 square feet.
Supply Slows, Lease-Ups Drag
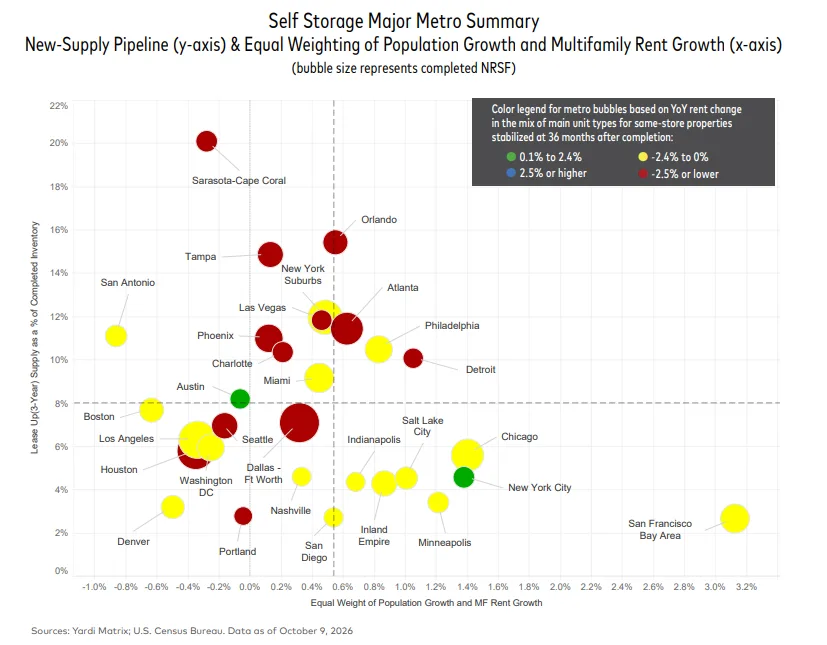
Yardi’s pipeline holds 2,324 projects at various stages, of which 594 are being built, 1,443 are planned and 287 are only prospective. Space being built equals 2.1% of existing stock, the same level reported last month in our coverage of Yardi’s September report.
New space delivered over three years equals 8.7% of starting inventory, and the last 12 months added 2.2%. The three-year share dropped in 21 of the 30 largest metros; Philadelphia, Charlotte, Boston and New York City each fell by over 300 basis points since last September.
Sarasota-Cape Coral is the most heavily built-out metro, adding roughly 25% to its stock in three years, yet pricing there has been sturdier than anticipated.
Two Metros Push Back
Austin and New York City were the only top metros with positive annual rate growth. New York City’s rate growth improved by about a point from August to 0.6%, helped by low recent deliveries and multifamily rent growth of 3.8%, second to San Francisco.
Austin posted +0.1% despite the steepest monthly decline, with university seasonality and improving housing affordability among the possible reasons.
Why It Matters
Slower building has not translated into stronger pricing, because lease-ups are taking longer and demand is soft. Matching weak demand with REIT discounting makes the fourth quarter look tough.
Occupancy gaps also support the ownership story. TractIQ data we covered showed independent operators leading the recovery, while Yardi shows REIT-owned stores holding occupancy better than third-party managed ones.
What’s Next
Yardi notes the annual declines may narrow, since the deep cuts of Q4 2025 set up easier comparisons. Watch whether the three-year delivery share keeps falling and whether lease-ups finally stabilize.