






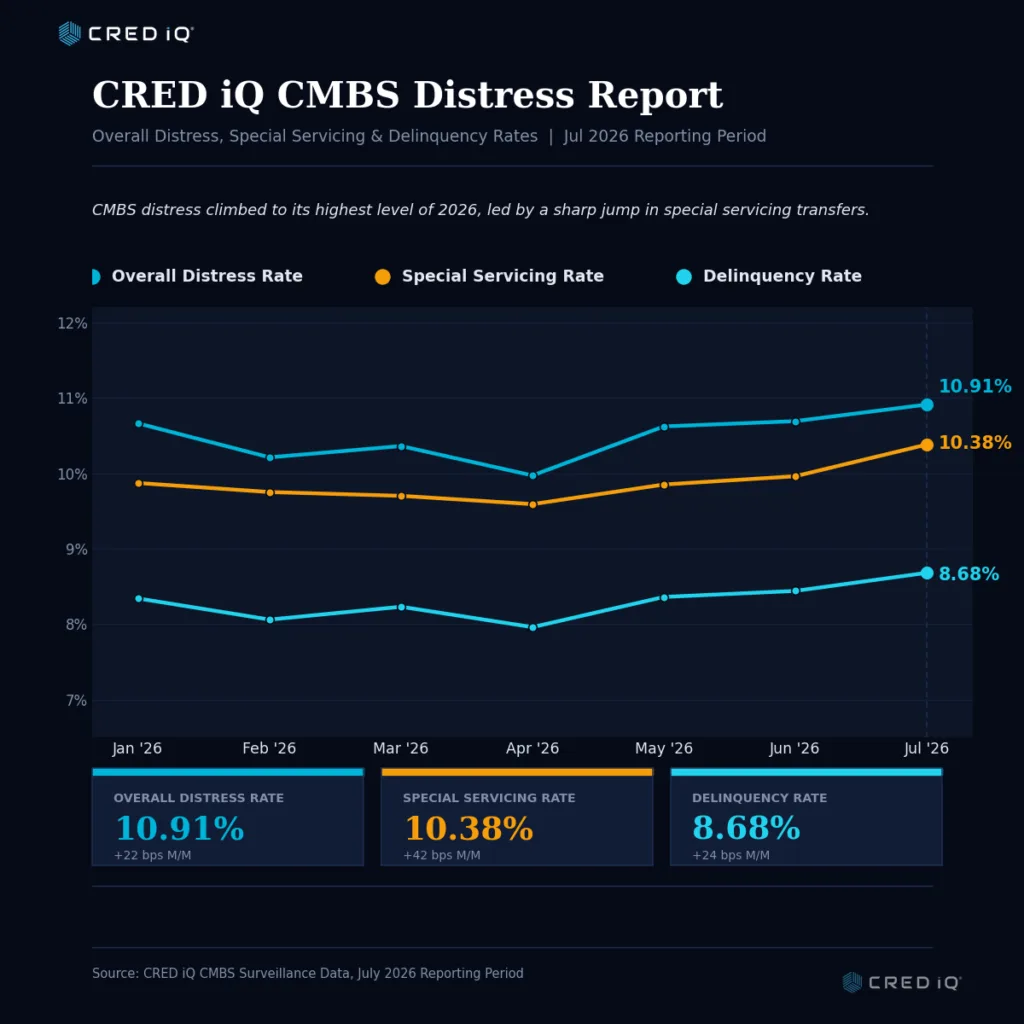
- The US CMBS distress rate hit 10.91% in July 2026, per CRED iQ, a 22-basis-point monthly jump driven by office sector weakness.
- Special servicing (10.38%) is moving higher faster than delinquency (8.68%), signaling more proactive problem management before missed payments.
- Granular data highlights that distress is highly concentrated by property type and metro, demonstrating why high-level figures don’t capture true risk.
Acceleration of CMBS Distress
CMBS distress accelerated across the US in July 2026. CRED iQ reported the overall distress rate reached 10.91%, its highest level this year. That figure rose from 9.97% just three months earlier.
Special servicing drove most of the increase instead of missed payments. That shift often signals trouble before delinquencies rise. CRE lenders, brokers, and investors can use the gap to identify emerging risks earlier.
July’s report also breaks down distress by deal type, property sector, and geography. Instead of relying on one headline figure, users can examine specific market weaknesses. CRED iQ tracks more than $600B in CMBS, giving market participants deeper visibility into uneven conditions.
Get Smarter about what matters in CRE
Stay ahead of trends in commercial real estate with CRE Daily – the free newsletter delivering everything you need to start your day in just 5-minutes
The Details
The July distress rate, which includes loans in special servicing or at least 30 days delinquent, increased 22 basis points month over month. It reached 10.91%. Special servicing climbed 42 basis points to 10.38%, marking 2026’s largest monthly increase.
Meanwhile, the delinquency rate reached 8.68% after rising 24 basis points. Loan-level data shows borrowers entered special servicing before missing payments. Many sought relief for maturities, cash management triggers, or other financial pressures.
Conduit loans recorded faster delinquency growth than single-asset, single-borrower loans. However, SASB distress still remains above historical averages. That distinction matters when investors price portfolio and bond risk.
Sector and Metro Divergence Deepens
Headline figures continue to mask major differences across sectors. Office posted a 16.65% distress rate, or 53% above the overall CMBS average. Special servicing drove much of that increase, showing lenders acted before widespread defaults.
Mixed-use properties reached 13.01%, while multifamily stood at 11.21%. By comparison, industrial posted just 2.35%, and self storage remained lowest at 0.28%. Those sectors continue to outperform in today’s lending environment.
Metro trends show similar divergence. Several large West Coast and Midwest markets reported distress rates well above the national average. Other major metros remained below 3%. As a result, national averages can hide meaningful local risks.
Why It Matters
For CRE professionals working with CMBS debt, loan-level data provides far greater insight than headline figures. CRED iQ’s July report shows new stress appears first through workouts and loan modifications. Delinquencies often follow later.
That early visibility helps portfolio managers and special servicers protect asset values before defaults occur. Acting sooner often improves recovery outcomes and limits losses.
Office distress also continues reshaping the market. It influences pricing for troubled assets, underwriting standards, and demand for distressed debt. Earlier this year, multifamily also experienced a sharp jump in CMBS distress, showing pressure has expanded beyond office. Meanwhile, industrial and self storage continue supporting stronger lending conditions and valuations.
Brokers, lenders, and advisors need more than national averages. They need precise information about where distress is rising and why. Tracking trends by property type, deal structure, and geography creates a meaningful competitive advantage.
Special servicing now leads delinquencies as the market’s primary warning signal. Investors who rely only on headline data risk missing deeper portfolio stress.
What’s Next
CRED iQ’s surveillance data suggests early interventions will continue. Special servicers are likely to receive more assets before formal delinquencies emerge. The biggest question remains whether office distress will keep rising or whether workouts already pulled forward much of the pressure.
Lenders and servicers will likely rely more on deal-level and market-level underwriting than broad national data. Risk appetite will continue driving transaction activity. Expect further divergence across property sectors and metros, while industrial and self storage remain the strongest performers.