








- National self storage rents fell 1.6% YoY in July 2026 as new supply slowed.
- Austin led rate gains at 2.1% YoY, but most metros posted annual rent declines.
- Pipeline contraction should support gradual rent recovery, but risks remain if turnover rises.
Supply Slowdown Begins to Shape Sector Recovery
The national self storage market entered the second half of 2026 with declining rents. However, supply pressures are beginning to ease. According to Yardi Matrix’s August 2026 Self Storage National Report, advertised rents fell 1.6% year-over-year in July.
New construction has slowed, creating a potential turning point for operators and investors. Yardi Matrix tracks 2,436 facilities in development. The under-construction pipeline equals only 2.1% of national inventory.
Completions and construction starts also declined. They fell 28% and 20%, respectively, compared with the first half of 2025. Trailing 12-month completions dropped to 2.4% of starting inventory, down from 3.0% in 2025.
Get Smarter about what matters in CRE
Stay ahead of trends in commercial real estate with CRE Daily – the free newsletter delivering everything you need to start your day in just 5-minutes
The Details
Most major metros still report negative annual rent growth across key unit types. The national average reached $16.47 PSF in July. Austin stood out with a 2.1% year-over-year increase after falling 4.3% a year earlier.
Minneapolis posted modest growth of 0.3%. Meanwhile, Charlotte and Tampa recorded declines of 3.3% and 4.4%. Los Angeles showed the strongest monthly improvement, with street rates rising 1.8% from June after emergency pricing restrictions ended.
However, demand remains weak nationwide. New move-in rents were about 40% below move-out rents in Q2. This gap supported occupancy but could create pressure when housing activity improves.
Broad-Based Rent Weakness, Localized Momentum
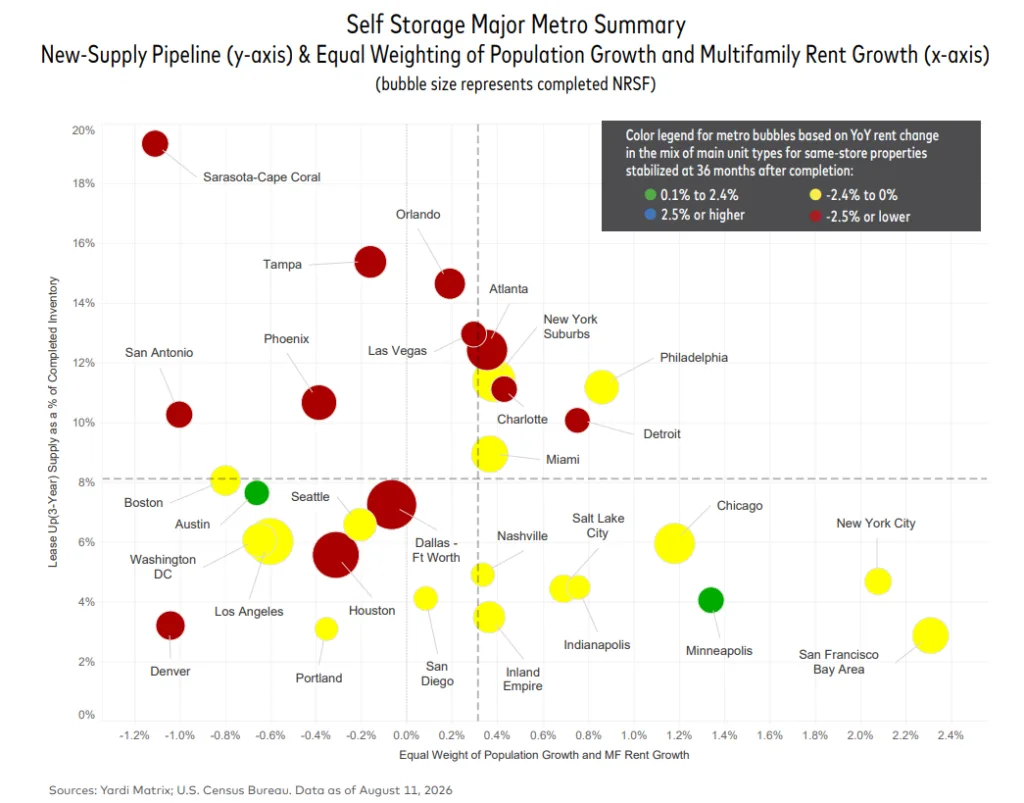
Rent declines continued in 26 of Yardi Matrix’s top 30 metros in July. Markets with heavy recent supply growth faced the most pressure. Tampa added 6.0% supply growth while rents fell 4.4%.
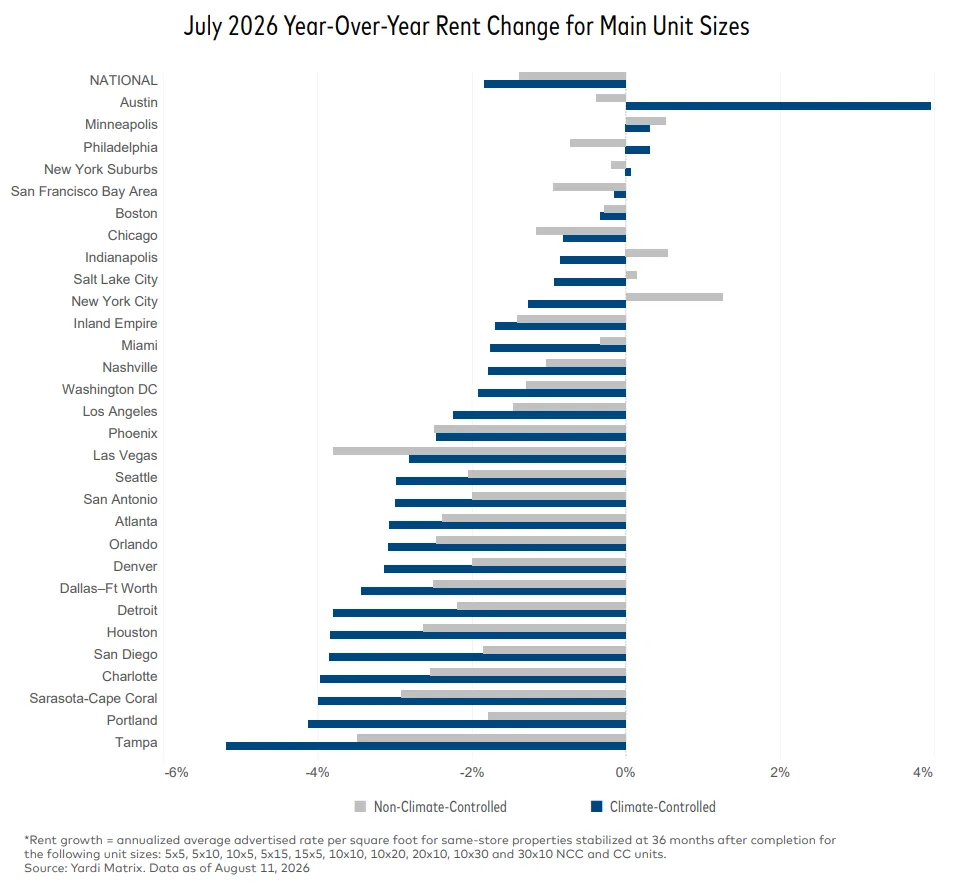
Sarasota–Cape Coral saw supply rise 9.5% and rents decline 3.6%. In contrast, markets with slower supply growth showed more stability. Minneapolis, Indianapolis, and the San Francisco Bay Area saw limited new supply and improving conditions.
Austin’s recovery reflects better affordability and continued population growth. Denver has struggled despite low supply growth, showing that demand remains a key factor. REIT-owned properties also underperformed private operators, with asking rents down 2.5% versus 1.2%.
Why It Matters
The 2026 supply pullback provides relief after years of rapid self storage expansion. Yardi Matrix reported that pipeline deliveries fell across every major US metro during the first seven months of 2026. Earlier market trends showed that slowing new supply could help stabilize self storage conditions, though operators still faced pressure from weaker rent growth and shifting demand patterns.
Still, stabilization depends on demand growth. Revenue gains in 2026 have mainly come from fewer move-outs rather than stronger tenant demand. Net move-in and move-out activity reached 1.6% of units, the highest level in five years.
The trend has protected occupancy but creates future risks. As tenant turnover returns, operators may face rent roll-down pressure. The large gap between move-in and move-out rents could force more aggressive pricing strategies.
What’s Next
The self storage sector will likely see modest rent declines through the rest of 2026. Yardi Matrix expects national completions to fall 19% from 2025 levels, with supply reductions continuing through 2028.
Operators should not expect an immediate recovery. Slower deliveries typically take time to improve market conditions. The main risk entering 2027 is rising tenant turnover and renewed pressure on rental rates.
Markets with strong population growth and limited supply, such as Austin and Minneapolis, may recover first. Areas still absorbing major new supply, including Phoenix and Orlando, could face pressure through late 2027 or longer.