









- The median life company industrial property is 250,000 square feet, versus 112,482 for CMBS and CRE CLO collateral, based on Trepp’s LifeComps Index and securitized loan data.
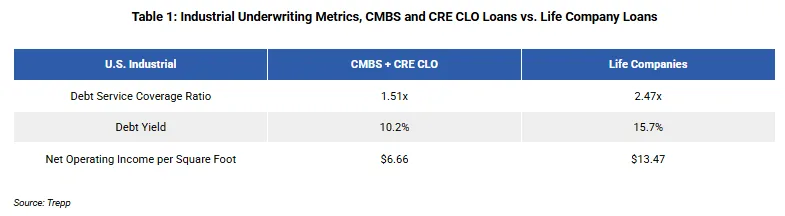
- Life company loans show a 2.47x debt service coverage ratio and 15.7% debt yield, compared with 1.51x and 10.2% for securitized industrial loans.
- Balance sheet lenders appear to favor larger, well-leased assets with stable income and conservative leverage, while securitized pools skew toward small buildings under 300,000 square feet.
Life insurance companies lend on larger industrial buildings than CMBS lenders do, according to Trepp research by Carly Pendergast.
The median life company industrial property is 250,000 square feet, more than double the 112,482-square-foot median behind CMBS and CRE CLO loans.
Get Smarter about what matters in CRE
Stay ahead of trends in commercial real estate with CRE Daily – the free newsletter delivering everything you need to start your day in just 5-minutes
Where the Data Comes From
On the life company side, Trepp’s LifeComps Index tracks 1,648 industrial loans worth $34.92 billion, and 533 single-property loans in it report a building size.
The securitized comparison spans 5,462 properties behind $71.77 billion in industrial CMBS and CRE CLO loans.
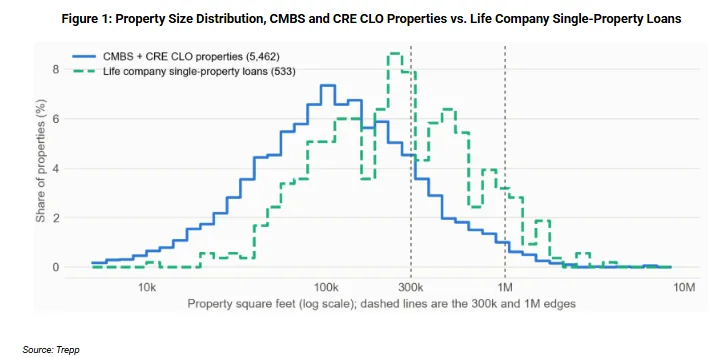
Securitized Pools Skew Small
Buildings under 300,000 square feet make up 83% of securitized properties and 55% of dollars lent. Mid-sized buildings, 300,000 to 1 million square feet, are 15% of the count and 35% of the balance.
Buildings at or above 1 million square feet are only 2% of the count yet 10% of balances.
Underwriting Gap
Life company loans lead in every underwriting category. Debt service coverage is 2.47x, versus 1.51x for securitized loans, and debt yield is 15.7%, versus 10.2%.
NOI per square foot shows the widest gap: $13.47 for life company collateral against $6.66 for securitized collateral. Industrial capital is chasing scale: Adkisson and PCCP recently bought a 2.7 million square foot Houston industrial campus, we reported.
Why It Matters
Trepp suggests lending models explain the gap. Because insurers keep loans on their own books, they may favor bigger, fully leased buildings with steady income and modest leverage they can hold to maturity.
Owners of smaller or more transitional buildings may lean on securitized or other capital instead. Insurers are also active elsewhere, as New York Life showed with a $480 million apartment refinancing.
What’s Next
Trepp frames the comparison as a snapshot of different lending behavior, not a ranking. Because it tracks both groups, future updates will show whether the gap persists.