






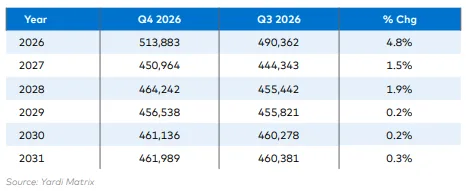
- Yardi Matrix expects 513,883 apartment completions in 2026, down 22% from 656,936 in 2025, with supply bottoming at 450,964 units in 2027 and edging up to 464,242 in 2028.
- Starts are still rising, up 16.6% year to date, but the pace is slowing each quarter, and units under construction without pre-leasing are up 15.6% from a year ago.
- Affordable and mixed-income projects hold up better than market-rate, and by 2028 they are forecast to deliver about 38% of new supply, as Sun Belt overhang markets keep trimming.
New apartment supply is on track to fall 22% in 2026 to 513,883 units and bottom at 450,964 in 2027, according to Yardi Matrix’s Q4 multifamily supply forecast.
Yardi raised its 2026 estimate 4.8% from the Q3 forecast. Yardi attributes the bump largely to refreshed pipeline data rather than a shift in view.
Get Smarter about what matters in CRE
Stay ahead of trends in commercial real estate with CRE Daily – the free newsletter delivering everything you need to start your day in just 5-minutes
The Forecast
After 2027, Yardi sees completions edging up to 464,242 in 2028 and settling near 456,000 to 462,000 a year from 2029 through 2031.
Supply peaked at 696,281 units in 2024, so the 2027 trough sits about 35% below the high.
The forecast assumes the economy stays largely steady, with fiscal deficits supporting income and job growth, and that longer-term rates stay elevated while the fed funds rate rises modestly.
Market-Rate Takes the Hit
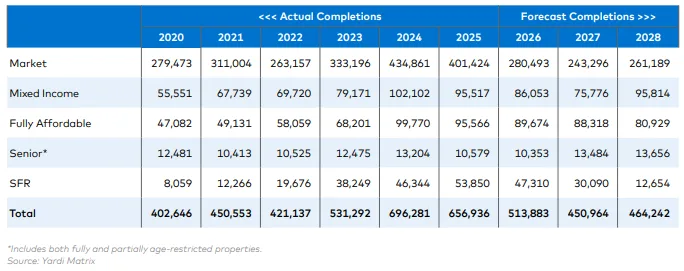
Market-rate completions drop from 434,861 units in 2024 to 243,296 in 2027. Fully affordable deliveries slip far less, from 99,770 to 88,318.
Mixed-income projects, which contain 5% to 89% subsidized units, fall from 102,102 to 75,776. Add the two together and 2028 deliveries reach 176,743 units, roughly 38% of the total.
Single-family build-to-rent communities of 50 units or more are fading, with completions forecast at 12,654 in 2028 versus 53,850 in 2025.
The Pipeline Shifts
Units under construction reached 961,350 as of quarter-end, up 1.6% from the prior quarter and flat from a year earlier. That equals 5.1% of 2025 year-end inventory in the markets Yardi tracks.
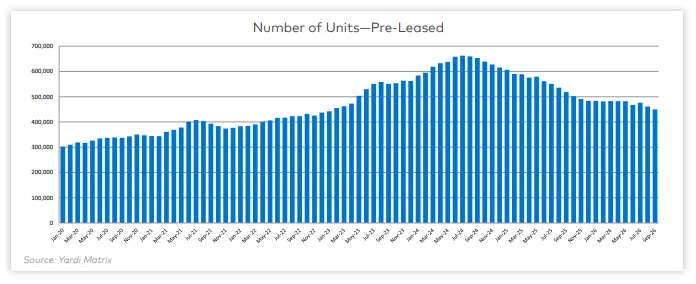
Pre-leased units under construction, now 449,706, are down 13.2% year over year and 32% from their July 2024 peak. Expect them to open this year or by September 2027.
The other group is growing. Units under construction without pre-leasing total 511,644, up 15.6% from a year ago, and they will not deliver until late 2027 or 2028. That is why Yardi expects 2028 supply to rebound.
Starts Are Slowing
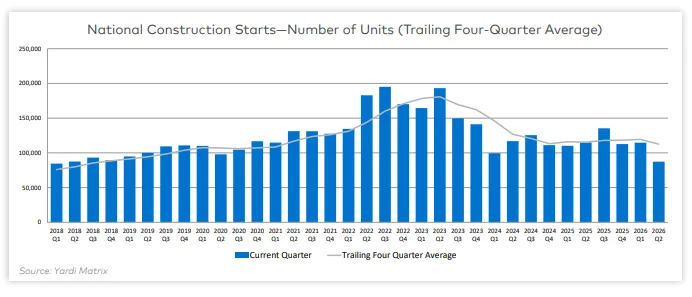
Through Q3, Yardi identified 242,267 units starting construction, 16.6% above the same period in 2025. But the gains are shrinking: Q1 was up 21.5%, Q2 up 12.2% and Q3 is running 12.8% higher so far. Yardi’s data arrives with a lag, so these totals will grow.
Starts peaked at 685,000 units in 2022 before dropping to 454,526 in 2024 and 475,000 in 2025. Census data show five-plus-unit housing starts at a 349,000 annualized rate in September.
Yardi says the mid-year jump in rates and inflation may be weighing on momentum. That fits the mood in our report on developer confidence, where NAHB’s multifamily production index slid to 41.
Where Supply Is Heaviest
Of the markets Yardi tracks, 94 posted more starts than a year ago and 81 posted fewer. Manhattan led the increases with 9,049 units versus 3,913, followed by West Houston and Northern Virginia. Columbus, Austin and the Inland Empire saw the biggest declines.
Eighteen large markets have over 8% of their inventory in the pipeline. Asheville tops the list at 15.8%, followed by the Southwest Florida Coast at 14.8%. Charlotte (24,443 units), Northern New Jersey (25,045) and Miami (19,930) have the biggest pipelines, and Brooklyn is on the list at 9.6%.
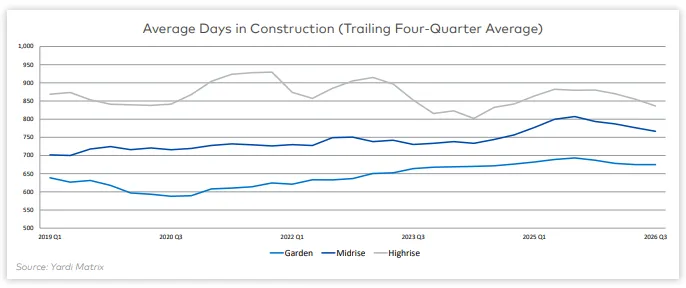
Garden projects completed in Q3 took 697 days to build, above the 675-day four-quarter average. Mid-rise took 751 days and high-rise 769, both below their averages.
Why It Matters
Markets working through a supply overhang, with weak or negative rent growth, will keep cutting market-rate starts. Markets with rising rents will hold or add supply.
The contrast is visible in coverage we ran this week: Bay Area asking rents rose 9% year over year while new supply grew at about one-sixth the national pace, per CoStar.
Yardi also notes that high rates suppress new-development values but keep the single-family market locked up, which supports rental demand.
What’s Next
The next quarter of starts data will show whether higher rates and inflation have meaningfully slowed development. The pipeline behind that is deep: 1.141 million planned units and 3.543 million prospective units, both little changed this year.
Planned projects are also taking longer to launch. Q3 starts averaged 565 days in planning, well above 500 for a third straight quarter.