







- Deals totaled $143B in Q3, the most for a third quarter since 2022, lifting the nine-month total to $389.3B, up 17.9%, though the 2026 forecast was lowered to $520B.
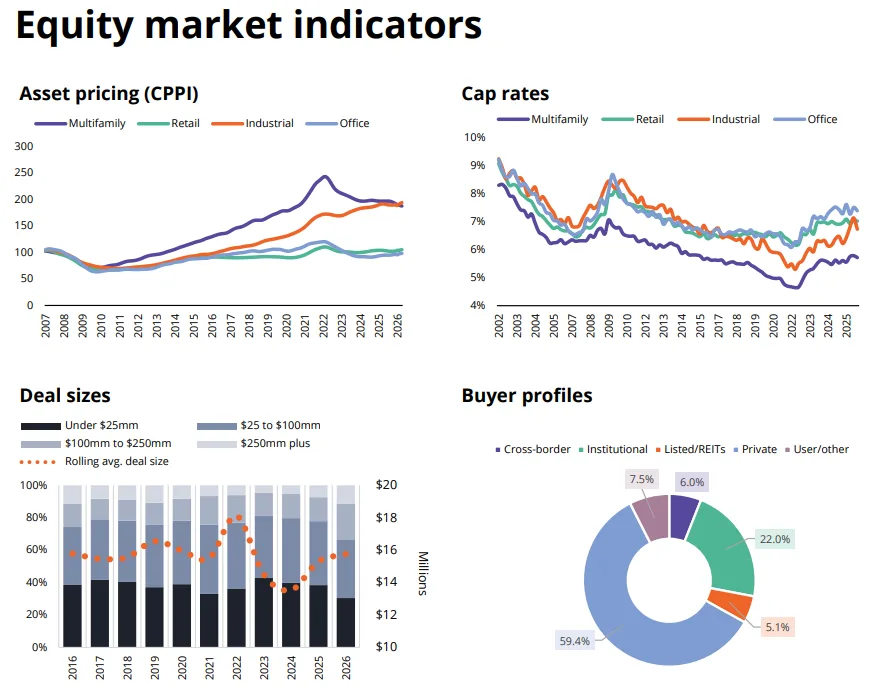
- Private buyers made up 59.4% of volume, CRE CLO issuance reached $36.8B, and the overall cap rate rose 22 bps to 6.56%, with industrial up 34 bps to 6.73%.
- Office volume rose 22.4% on discounted deals, apartment site sales fell nearly 40%, and capital shifted to supply-constrained markets like Washington, DC while Denver, Phoenix and Dallas-Fort Worth fell.
CRE investors closed $143 billion of transactions in Q3, the biggest third quarter since 2022, per Avison Young’s Q3 U.S. investment sales report, as GlobeSt reported.
Through nine months, volume totals $389.3 billion, a 17.9% jump over the same stretch of 2025, across 24,638 deals (up 11.2%). Even so, Avison Young trimmed its full-year projection to $520 billion because of current and expected Fed hikes.
Get Smarter about what matters in CRE
Stay ahead of trends in commercial real estate with CRE Daily – the free newsletter delivering everything you need to start your day in just 5-minutes
Private Money Drives the Market
Private investors supplied 59.4% of volume. Institutions came in at 22.0%, owner-users at 7.5%, cross-border buyers at 6.0% and listed REITs at 5.1%.
Those who do borrow are favoring short-term, floating-rate bridge loans. CRE CLOs, which bundle those loans, have issued $36.8 billion from 37 deals so far, 5% ahead of where 2021 stood. With the Fed tightening again, those value-add plans have little room for delay.
New York shows the benefit of equity-heavy buyers. Its buyers lean less on debt, so volume there climbed 21.7% to $37.4 billion even with the 10-year over 5%. Owner-users, private investors and REITs lead the way.
Smaller Deals, Higher Cap Rates
Transactions in the $25 million to $250 million band account for 58% of dollars and are growing their share, while trades over $250 million rose to 12%. Roughly two-thirds of transactions were below $100 million.
Buyers are accepting thinner yields. Across the first three quarters, the blended cap rate rose by 22 bps, reaching 6.56%. Industrial moved most, up 34 bps to 6.73%, yet that sector’s dollar volume still climbed 41.5%, reaching $113.3 billion, with deal count up 22.7%.
Spreads over Treasuries help explain the demand. In Los Angeles, quarter-end industrial cap rates stood a half point over the 10-year, and in Dallas and Chicago the cushion was close to 200 basis points.
Office Buys the Dip
Office sales volume reached $67.5 billion, up 22.4%, though cap rates edged just 3 basis points higher to 7.39%. A lot of the activity is happening at reset prices.
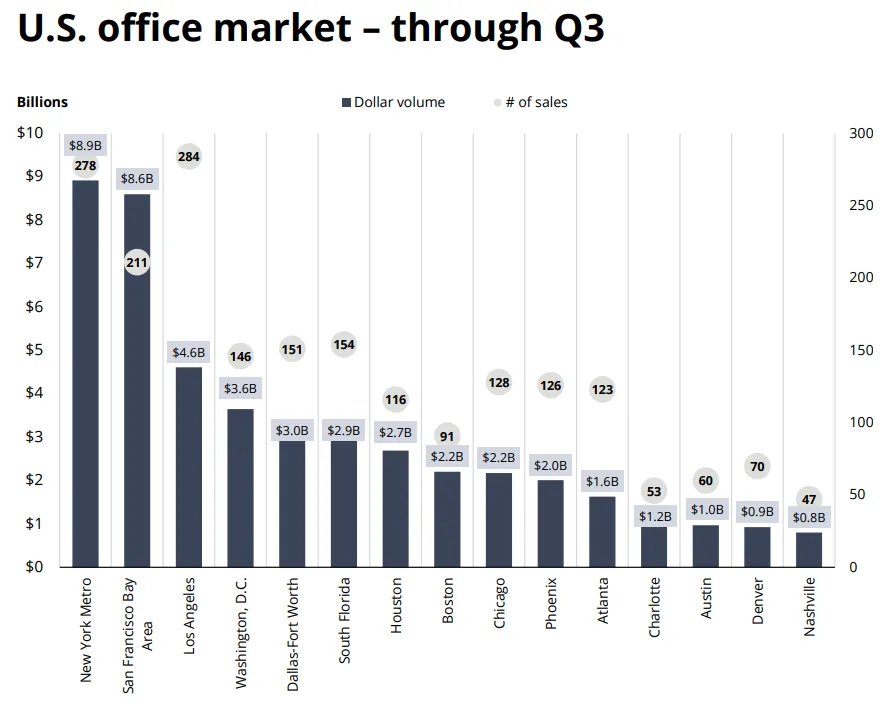
In Chicago’s CBD, notable trades went for about 75% less than their previous sale prices. In Washington, local private buyers picked up good-to-great office buildings for under 75% of replacement cost.
Phoenix office volume surged 60.6%, a move Avison Young said reflects ‘repricing more than renewed conviction.’ The flip side shows up in lending: CRE Daily’s coverage of the office refinancing gap found Trepp data showing three in four maturing Class A CMBS office loans would need new equity at current rates.
Multifamily Stalls
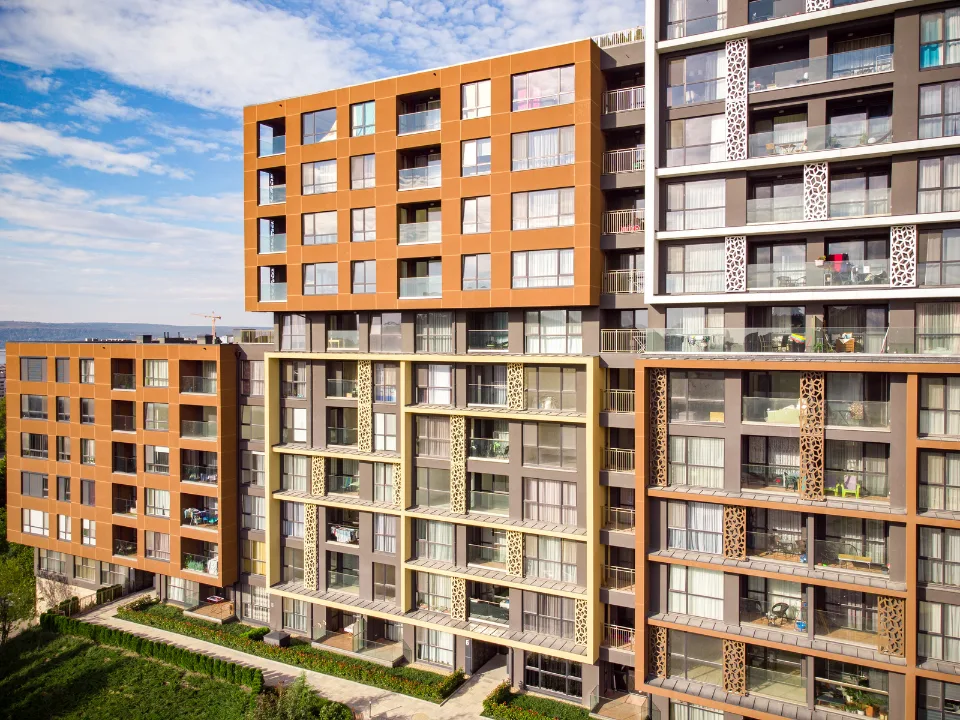
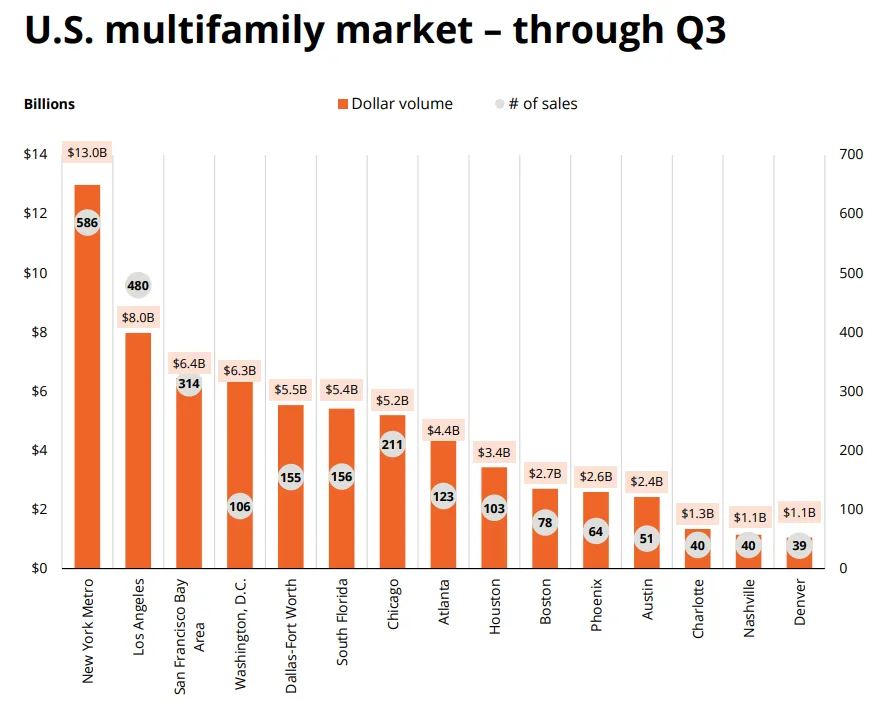
Apartments remain the largest category at $119.6 billion, 31% of the total, yet dollar volume grew just 3.0% and count 2.0%. A 5.72% cap rate, the lowest of any sector, leaves little room over a 10-year yield above 5%.
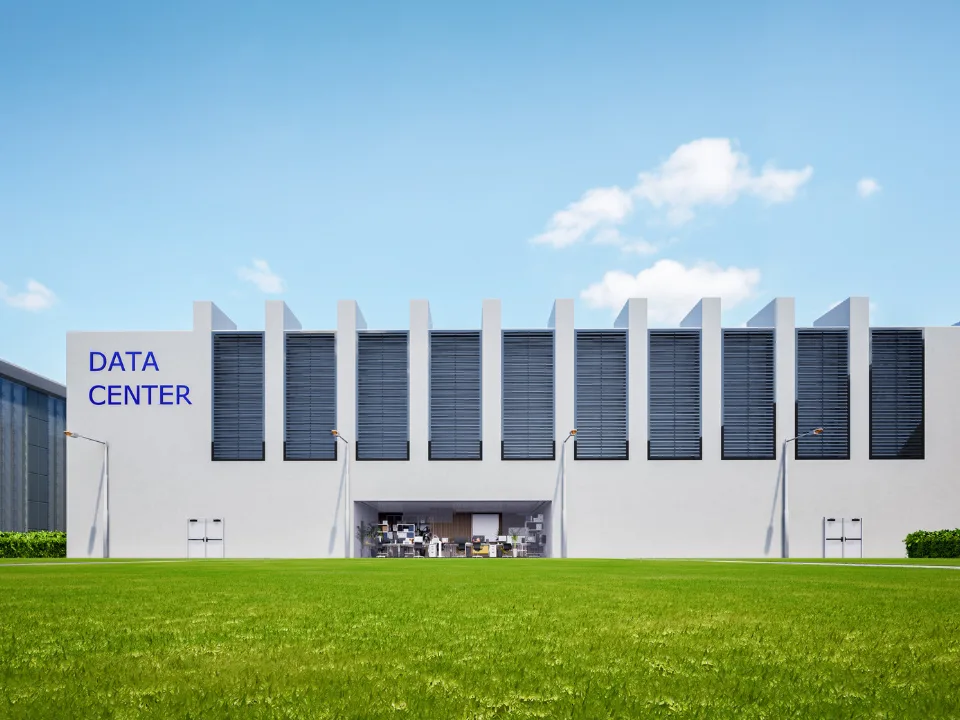
Land trades tell a similar story. Apartment sites fell almost 40% in dollars and deal count, while office sites jumped 246% and industrial sites about 165% to 175%. Data center land drew roughly $8.3 billion in only 66 deals.
Money followed scarcity. Washington, DC apartment volume surged 128.7% to $6.3 billion with construction down to 1.86% of inventory, and New York gained 36.0%, where a rent freeze covering about one million stabilized units steered buyers toward buildings that can still raise rents.
Where supply is heavy, capital left. Denver fell 52.9% with 9.89% vacancy and 8.8% concessions, Phoenix dropped 28.9% on new supply and Dallas-Fort Worth slid 19.6%. Among the top 15 markets, Chicago had the biggest volume gain, up 76.5% to $15.1 billion.
Why It Matters
A $143 billion quarter proves capital is moving, but with more equity, shorter debt and steeper discounts. CBRE leaders said on their earnings call, as CRE Daily reported, that higher rates are pushing buyers and sellers to reprice deals.
Buyers who rely on cheap debt are sitting out, and Avison Young’s lower forecast hints that volume could cool.
What’s Next
Hitting the $520 billion forecast takes about $131 billion in the fourth quarter, less than Q3’s $143 billion.
Floating-rate bridge borrowers behind the CRE CLO boom will get their test as the Fed raises rates again.