






- Cap rates increased across all nine US Census divisions from 2022 to 2025, recalibrating multifamily property values nationwide.
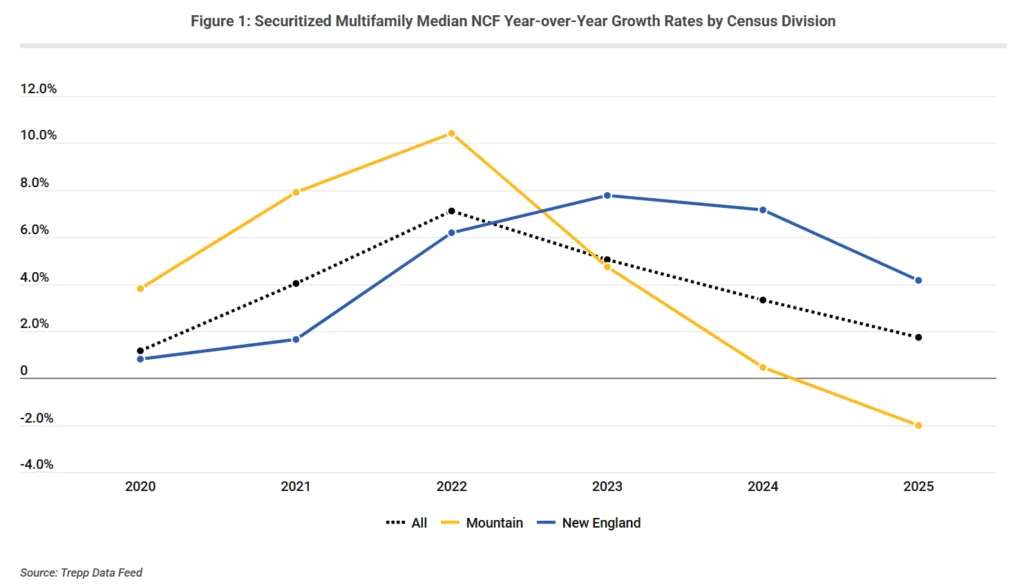
- Cash-flow growth diverged sharply by region, buffering values in strong markets like New England while compounding declines in weaker areas like the Mountain division.
- For investors and lenders, value protection now relies as much on forward cash-flow outlook as on responding to capital market pressures.
Higher Required Returns Reshape Multifamily Valuations
Multifamily values have broadly reset since 2022. The shift did not come from uniform cash-flow declines. Trepp data shows median appraisal cap rates rose across every US Census division through 2025.
The increases ranged from 43 basis points in New England to 107 basis points in the Mountain states. This trend reflects a sector-wide change in required investor returns. Meanwhile, property net cash flow (NCF) continued growing in most regions.
Cap rates depend on income, capital markets, and financing costs. Rising yields did not always mean weaker NOI. Instead, higher return expectations drove uneven repricing across markets.
Get Smarter about what matters in CRE
Stay ahead of trends in commercial real estate with CRE Daily – the free newsletter delivering everything you need to start your day in just 5-minutes
The Details
Trepp’s analysis highlights the scale of the reset. The national median appraisal cap rate rose from 4.83% in 2022 to 5.64% in 2025. That represents an 81-basis-point increase.
New England cap rates climbed from 5.37% to 5.80%. The Mountain division saw a larger jump, rising from 4.33% to 5.40%. During the same period, national median NCF still grew 1.8% in 2025.
Regional performance varied significantly. New England recorded 4.2% NCF growth after 7.1% growth the prior year. Mountain markets fell from double-digit growth in 2022 to a 2.1% decline by 2025.
Cash-Flow Divergence Widens the Gap
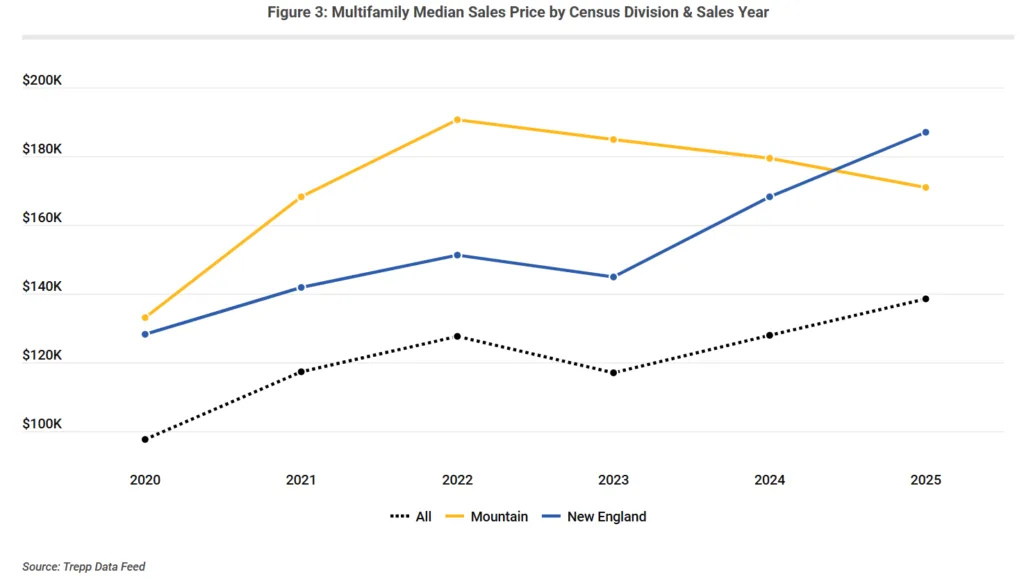
The valuation reset affected markets differently. New England multifamily assets absorbed higher cap rates while prices increased. Median sales prices per unit rose 23.5% to about $186,900 by 2025.
The Mountain division faced a tougher environment. Lower cash flow and rising cap rates pushed prices down 10.3% to about $170,900 per unit. Nationally, prices still increased 8.6% to $138,500.
These results show how local fundamentals shaped outcomes. Higher required returns created a new valuation baseline. Stronger income growth helped markets avoid deeper losses.
One Capital Markets Shock, Many Local Outcomes
The cap-rate reset came from changing investor expectations. It did not result from a broad operating collapse. The Gordon Growth model shows why.
Cap Rate = Required Return – Growth. When required returns rise, values decline unless growth offsets the increase. Higher capital costs and risk premiums drove much of the repricing.
The Mountain division faced pressure on both sides. Cash-flow growth slowed while cap rates expanded. New England benefited from stronger rental performance, which provided a cushion.
Why It Matters
The reset changes multifamily underwriting strategies. Strong rent growth alone no longer guarantees value protection. Investors must evaluate local income trends and future exit yields.
Lenders also face greater risks. Higher cap rates reduce collateral values and increase loan-to-value ratios. Refinancing challenges may grow even when current cash flow remains stable.
Markets with weak NCF trends face the most pressure. The Mountain states show how declining operations and higher required returns can combine. Trepp’s analysis highlights a more selective lending environment ahead.
The broader lesson is clear. Multifamily values now depend on both property performance and capital market expectations. Investors need disciplined underwriting across both factors.
What’s Next
The diverging fortunes of regional markets set a contentious backdrop for future deals and lending decisions. As investors assess these valuation resets, capital will likely move toward markets with stronger operating performance and clearer growth potential.
Recent market rankings show that investors continue prioritizing multifamily markets with favorable fundamentals, highlighting a broader shift toward selectivity across regions. Markets with negative or flat NCF growth and larger cap-rate expansions may face further price discovery and slower transaction activity.
For now, lenders and borrowers must navigate an environment where value protection begins with careful analysis of both capital markets and local cash flows.