








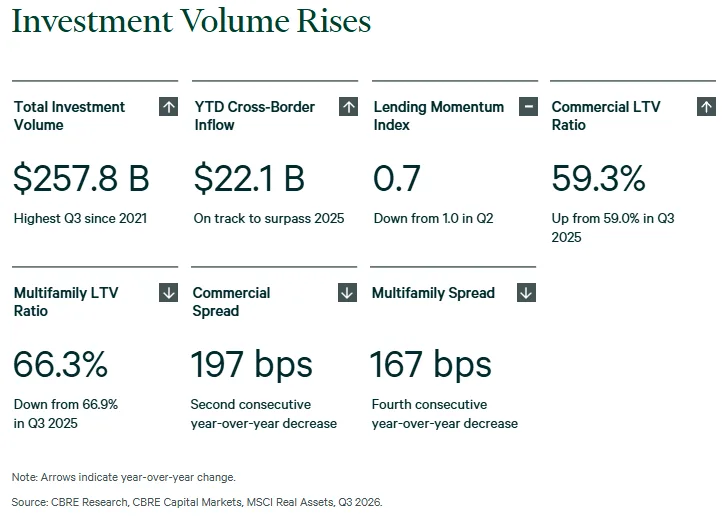
- CRE investment volume rose 98% year over year to $257.8B in Q3, but two entity-level deals totaling $104B explain most of the jump. Excluding them, volume grew 18%.
- Multifamily led at $112.3B, ahead of industrial and data centers. REITs and public companies were the biggest buyers, and alternative lenders wrote nearly half of CBRE’s non-agency loan closings.
- Spreads are tighter and interest-only loans are more common, while debt service coverage slipped. Lenders are competing on price, even as borrowers carry a bit more leverage.
U.S. CRE investment volume jumped 98% from a year earlier to $257.8 billion in the third quarter, according to CBRE’s Q3 2026 capital markets report. A pair of entity-level transactions worth $104 billion between them did the heavy lifting.
Take those out and volume still rose 18%. That is the number to anchor on.
Get Smarter about what matters in CRE
Stay ahead of trends in commercial real estate with CRE Daily – the free newsletter delivering everything you need to start your day in just 5-minutes
Multifamily Leads, REITs Buy
Multifamily topped every sector at $112.3 billion. Industrial came second at $40.4 billion, and data centerss third at $34.5 billion.
REITs and public companies were the largest buyer group at $89.3 billion, ahead of private investors at $79.7 billion. D.C., Los Angeles and New York drew the most capital.
Through nine months, volume is up 59% to $528.3 billion, or 24% without the entity-level deals. Inbound cross-border money added to it: $22.1 billion so far, up 30% and close to the $23.8 billion booked in all of 2025.
Alternative Lenders Take the Wheel
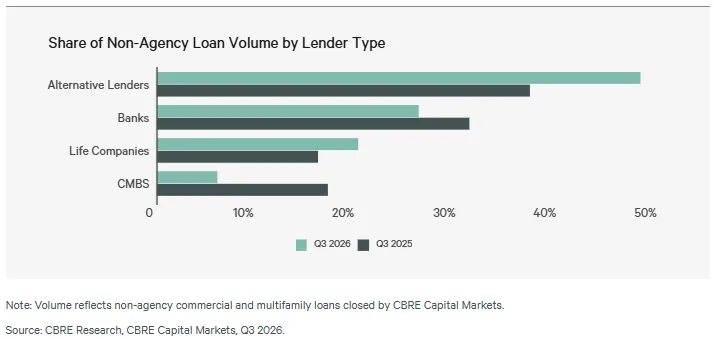
Non-agency closings at CBRE tilted toward alternative lenders in Q3: 48% of volume, compared with 37% last year. Banks slipped to 26% from 31%, and life companies held at 20%.
CMBS lenders fell hardest. Their share dropped to 6% from 17%.
CBRE’s Lending Momentum Index ended the quarter at 0.7. That matches last year but sits below the 1.0 reading at the end of Q2.
Spreads Tighten, Leverage Creeps Up
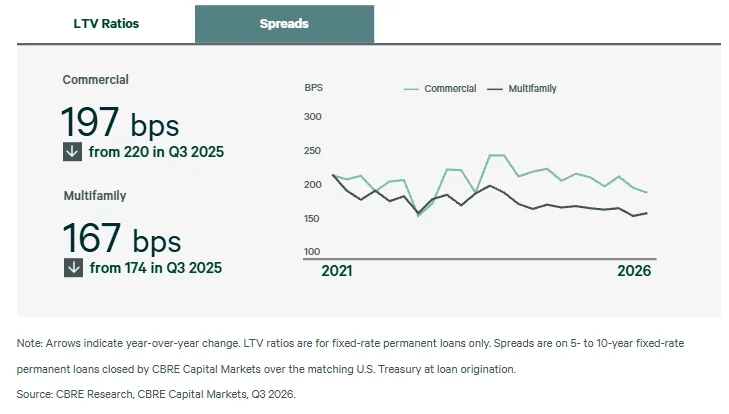
Commercial spreads narrowed 24 bps from a year ago to 197 bps. Multifamily spreads tightened 7 bps to 167 bps.
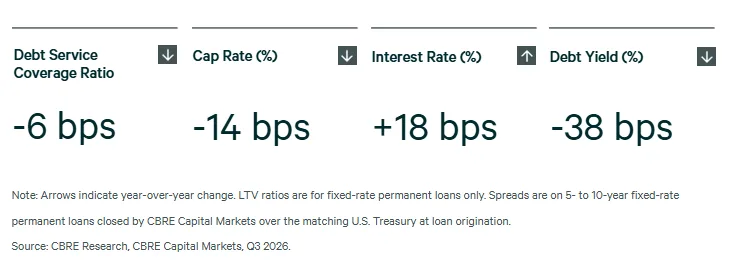
Commercial loan-to-value averaged 59.3%, up slightly from 59.0%, while multifamily LTV eased to 66.3% from 66.9%. Debt service coverage fell to 1.32 from 1.38 and debt yield to 9.5% from 9.9%.
Interest-only structures now cover 82.3% of loans, up from 80.2%. Average mortgage rates rose to 6.0% from 5.8%, and cap rates slid a tenth of a point to 6.0%.
Zoom Out
As we covered in CBRE’s Q2 report, volume was up 21% through midyear. The third-quarter spike changes the scale of the year-to-date picture, though not the direction.
Cap rates holding at 6.0% also cuts against CBRE’s own late-October cap-rate warning. Research there projected a rise of at least 40 to 60 bps with the 10-year Treasury near 5%.
Why It Matters
A 98% headline invites the wrong read. The cleaner signal is 18% growth in the quarter and 24% year to date, with lenders pricing aggressively and public buyers active.
The mix of tighter spreads, more interest-only loans and thinner coverage ratios also means borrowers are getting cheaper debt at the cost of some cushion.
What’s Next
CBRE’s August midyear outlook forecast a 16% rise in 2026 investment volume. The underlying year-to-date pace is already running ahead of that, though rate swings could test Q4.