






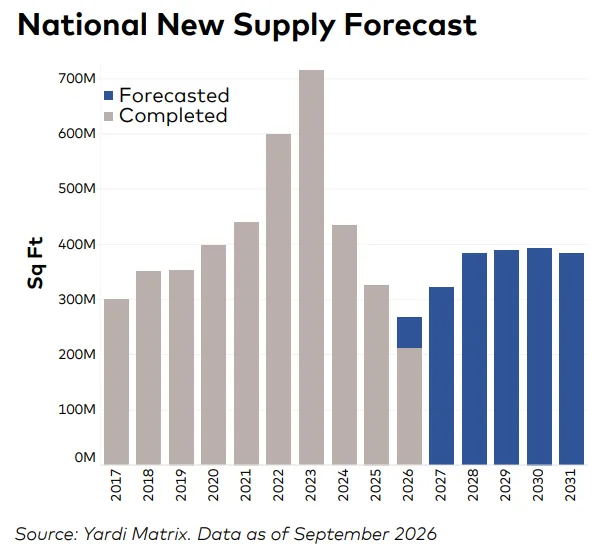
- Industrial starts reached 274.4M SF through three quarters of 2026, after 342.1M SF in 2025, putting the year on pace to be the busiest since 2022’s record.
- Power access is the top siting constraint, with 79% of Site Selectors Guild respondents ranking it a leading factor, while construction input prices rose 11.9% in the year to September.
- Hurdles should cap supply and support rents: in-place rents averaged $9.33 per SF, up 5.3% from a year earlier and led by Dallas at 7.9%, even as national vacancy reached 9.7%.
Industrial development keeps rebuilding in 2026, with 274.4M SF of new projects breaking ground through September, according to Yardi Matrix’s October industrial report.
Starts totaled 342.1M SF in 2025 after bottoming at 306.8M SF in 2024. At the current pace, this year would see the most space begun since 2022.
Get Smarter about what matters in CRE
Stay ahead of trends in commercial real estate with CRE Daily – the free newsletter delivering everything you need to start your day in just 5-minutes
Power Is the Bottleneck
A Site Selectors Guild survey found that 79% of respondents rank power access among the top factors when choosing a site. In many cases, it determines whether a project can move forward at all.
However, high power demand also fuels community resistance. Residents raise concerns about traffic, air quality and lost open space. As a result, entitlements take longer to secure. Meanwhile, landowners are charging steep premiums for shovel-ready sites with power already available.
Similar local opposition is emerging around data centers. In fact, CRE Daily reported that roughly 2,100 jurisdictions considered data center restrictions in the 12 months through September.
Costs Climb
The Bureau of Labor Statistics’ September producer price index shows that input costs for new nonresidential construction rose 11.9% year over year. By comparison, nonresidential construction costs overall increased 5.4%.
Tariffs are driving much of the increase. For example, steel prices are up 28%, aluminum 25%, and copper and brass 30%. Additionally, Yardi reports that diesel prices have climbed 70% since the Iran War began. Consequently, sitework and freight bills are rising.
Pipeline and Owner-Users
Projects under construction total 463.3M SF, or 2.2% of existing stock. That’s up from 357.4M SF in January. Phoenix has 31.4M SF underway, equal to 6.9% of its inventory, while Dallas has 39.6M SF.
Several other markets also have substantial pipelines relative to their size. Columbus leads at 5.1%, followed by Dallas at 3.7%, Atlanta at 3.5% and Houston at 3.3%.
Meanwhile, owner-occupiers account for 27.0% of 2026 starts, totaling 76.1M SF. That’s down from 29.7% in 2025, when their 103.2M SF represented the second-highest annual total this decade. Only 2020, with 108.3M SF, was higher. Separately, JLL’s Q3 figures showed 317M SF underway, with about a third classified as build-to-suit or owner-user.
Rents Keep Climbing
In September, in-place rents averaged $9.33 per SF, up 5.3% over 12 months. Dallas led the country with 7.9% growth, while Miami followed at 7.5%. Atlanta, meanwhile, slipped to third place.
At the same time, national vacancy reached 9.7%. That’s 40 basis points above August and 20 basis points higher than a year earlier.
New leases signed over the past year average $10.13 per SF. However, that’s only 80 cents above the average for existing space. The gap is widest in Bridgeport at $3.98, followed by Miami at $2.79 and Dallas at $2.48.
Demand Signals
Trade activity remains strong. In August, imports reached $342.2B, up 28.4% year over year. Exports also rose, reaching $205.7B, a 15.3% increase.
Additionally, core retail sales totaled $537.2B in September, up 5.0%. Together, these trends continue to support demand for logistics space, even as warehouse hiring remains flat.
Chicago Climbs the Sales Ranks
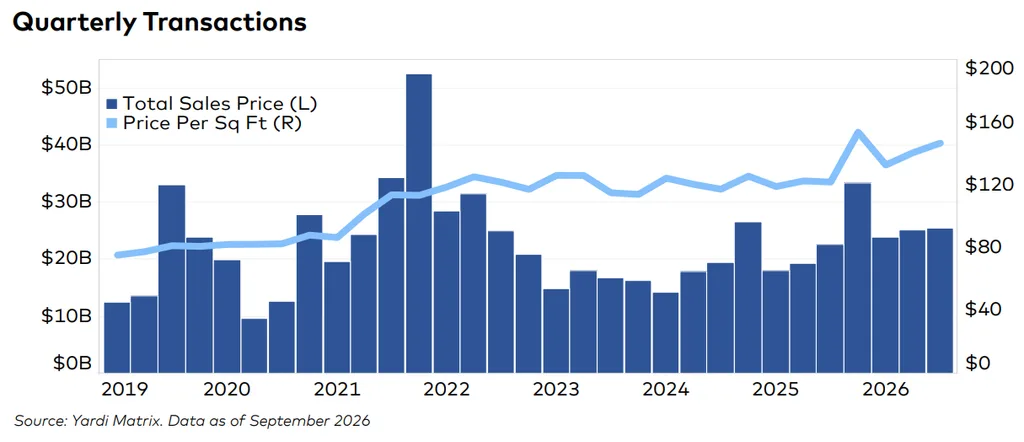
Yardi tracked $74.7B in industrial sales through September, at an average of $140 per SF. Notably, Chicago recorded $4.4B in sales. The market hadn’t ranked above fifth place in four years.
However, one transaction significantly affected the numbers. GI Partners paid $750M for a converted data center in Elk Grove Village. That deal accounted for nearly 17% of the area’s total volume.
Excluding data centers, the average price falls to $101 per SF. Even so, that’s still a 10.3% increase.
Why It Matters
Yardi expects starts to continue edging higher in the near term. However, power shortages, entitlement delays and rising costs should limit future supply. In turn, these constraints could support rent growth later on.
Meanwhile, jobs and space demand are moving in different directions. Warehouse employment stands at 1.83M, down 1.2% from a year ago and 5.5% below its March 2022 peak. At the same time, automation is increasing productivity per worker.
What’s Next
The next key indicator is whether owner-occupied builders maintain their roughly 27% share of starts. If power shortages and cost pressures persist, speculative developers are likely to feel the impact first.