



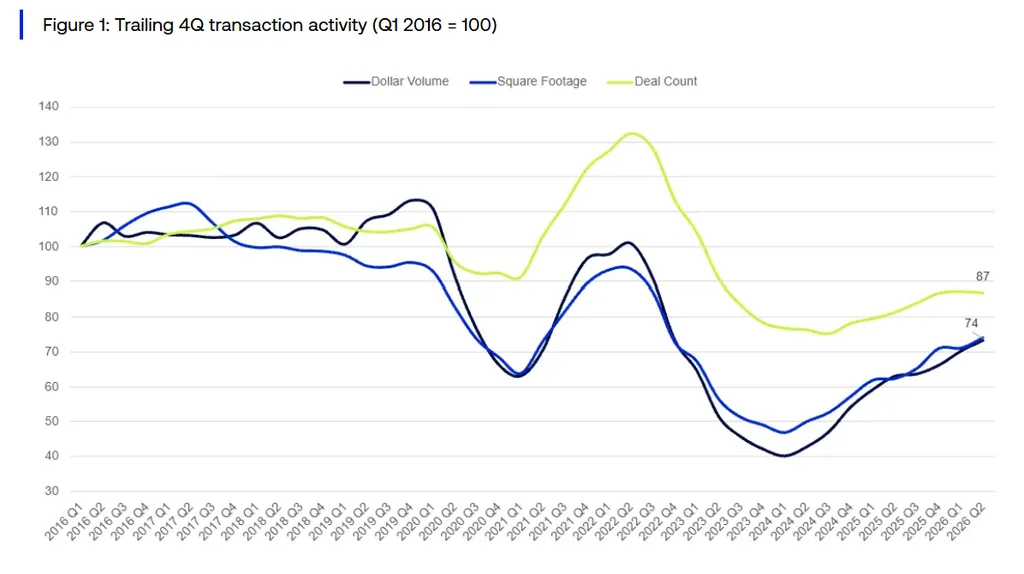
- Office deal counts have recovered faster than square footage and dollar volume, showing that smaller transactions carried much of the rebound.
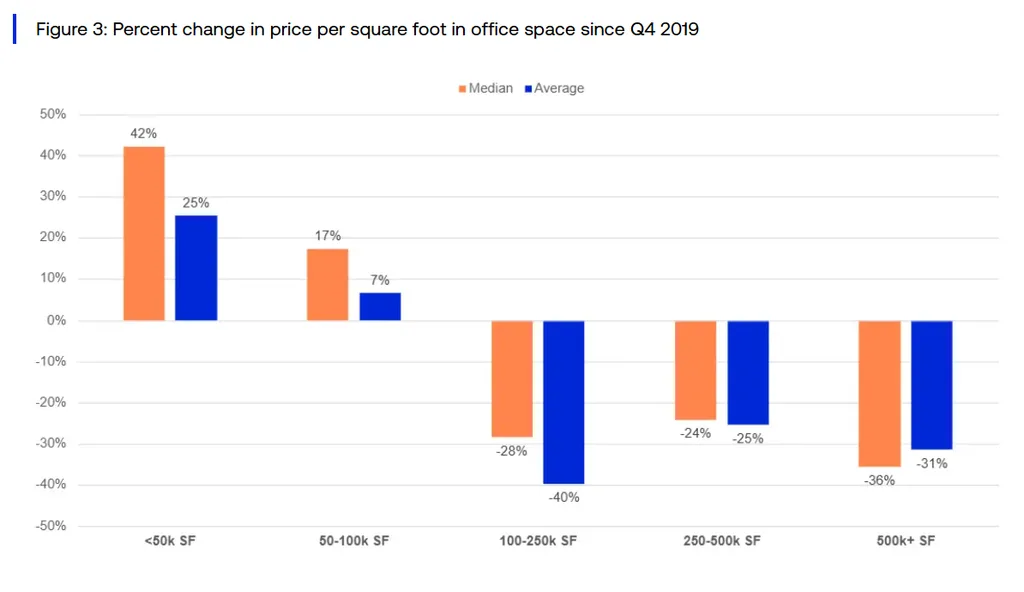
- Buildings above 500,000 SF regained much of their pre-pandemic share of traded space, yet median pricing remains 36% below Q4 2019.
- The historic pricing premium for large office assets has compressed as smaller buildings hold value better and bigger properties re-enter at lower prices.
Altus Group’s latest analysis finds that office transaction counts have moved back toward pre-pandemic levels even though pricing tells a different story. Deal activity has recovered faster than the amount of space and capital changing hands. That gap matters because a large property counts as one deal but can represent far more SF and value. The result is an office recovery driven heavily by smaller transactions. Larger buildings are returning at materially lower pricing than before the pandemic.
Get Smarter about what matters in CRE
Stay ahead of trends in commercial real estate with CRE Daily – the free newsletter delivering everything you need to start your day in just 5-minutes
Deal Count Leads the Recovery
Altus compared trailing four-quarter office activity across deal count, SF and dollar volume. From the post-COVID peak to the trough, deal count fell 43%. Traded SF dropped 50%, while dollar volume declined 64%. The shallower fall in transaction count shows how smaller deals remained more active as large assets pulled back.
The split was visible even during the 2021 to 2022 peak. Deal count climbed to roughly 130% of its 2016 baseline, but SF and dollar volume barely returned to that level. In other words, the apparent boom reflected more transactions without a comparable recovery in space or capital. That same distinction remains important as current activity improves.
Source: Altus
Altus cautions that transaction volume alone cannot distinguish a true recovery from repricing. More trades can reflect renewed confidence, forced sales, or a market clearing at lower values. That is why the three measures matter together. Deal count captures activity, while traded SF and dollar volume reveal how much property and capital are actually moving. In the current cycle, those measures still describe a market where activity has recovered faster than value at the large-asset end.
The Details
The composition of sales is now moving closer to its pre-pandemic pattern. Buildings below 50,000 SF represented 30.2% of office space traded in Q4 2019. Their share peaked at 43.8% in Q3 2023. Meanwhile, properties above 500,000 SF fell from 20.9% of traded space to only 8.4%.
By Q2 2026, the 500,000-plus segment had recovered to 18.9% of traded SF. Average building size also increased from about 27,700 SF in late 2023 to roughly 35,200 SF in the latest quarter. The mix looks more normal, but the values attached to those larger assets do not.
Pricing Splits by Building Size
Since Q4 2019, median price PSF rose 42% for buildings below 50,000 SF and 17% for those between 50,000 and 100,000 SF. Above 100,000 SF, the direction reversed. Median pricing fell 28% for the 100,000-to-250,000-SF bucket, 24% for 250,000 to 500,000 SF, and 36% for buildings above 500,000 SF.
Source: Altus
The pricing split adds context to office transaction activity in 2026 as larger buildings return to the market. Across all office assets, median price PSF increased about 36% from Q4 2019 to Q2 2026. Average pricing, however, fell about 13%, reflecting the weaker contribution from large properties.
Why It Matters
Office historically carried a clear size premium. In Q4 2019, average pricing was about $172 PSF versus a $100 median, a gap of roughly $72. By Q2 2026, the average was $150 and the median was $135, narrowing that spread to about $15.
That compression changes how investors should read the recovery. Large assets are re-entering the transaction mix, but they no longer pull market-wide pricing higher as strongly as they once did. More deals can therefore coexist with lower capital volumes and weaker values at the top end. Altus characterizes the market as a reset in what buyers will pay for scale, not a return to the prior cycle.
The divergence also helps explain why headline transaction counts can look stronger than aggregate market value. A smaller office sale and a major tower sale each add one transaction. Their effect on traded SF and dollars is very different. Tracking all three measures keeps the improving deal count from obscuring the weaker pricing power of large assets.