


- Multifamily and industrial assets drove the largest share of US CRE transaction value and price gains in Q1 2026, per Altus Group.
- Median price per SF reached all-time highs in most sectors, with industrial prices up 11.8% year-over-year and retail climbing 10.4%.
- Big-ticket ($10M+) transactions now account for over half of all dollar volume, signaling a tilt toward larger deals.
Momentum Shifts Toward Large Deals and Key Asset Types
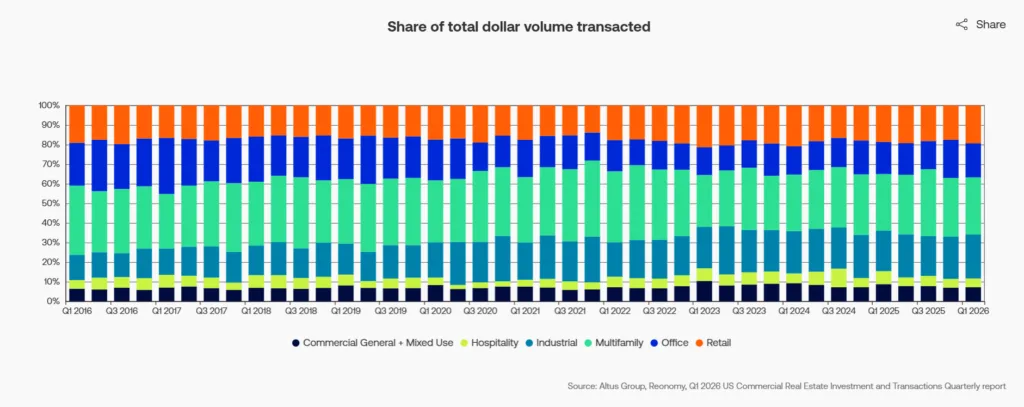
According to Altus Group’s Q1 2026 US Commercial Real Estate Investment & Transactions Quarterly report, the commercial property market is seeing a pronounced skew toward bigger-ticket deals and select property types. Multifamily assets led the pack, representing 29.2% of single-property dollar volume and 29.6% of trades by count, with industrial claiming 22.4% of value despite making up just 14.8% of properties traded.
The report also highlights that transactions above $10M now account for 50.5% of all single-property deal value, marking three straight quarters above the 50% threshold—an uptick from the post-GFC low of 42.3% seen in Q2 2023. This shift suggests a return of institutional capital and a willingness to transact at scale amid record-high asset pricing in several sectors.
Get Smarter about what matters in CRE
Stay ahead of trends in commercial real estate with CRE Daily – the free newsletter delivering everything you need to start your day in just 5-minutes
The Details
Multifamily saw the highest share of both traded properties and overall transaction value, exceeding even retail (23.3%) and office (16.7%) by count in the national breakdown. Industrial’s dominance on value versus volume—22.4% of value from just 14.8% of properties—highlights investor preference for high-value logistics and warehouse assets. Meanwhile, office and retail both gained ground in transaction size, with office deals over $10M reaching 57.3% of that sector’s value, recovering from a 35.2% trough in mid-2023.
Median prices per SF hit new all-time highs in nearly every sector except hospitality in Q1 2026. Industrial led annual price growth at +11.8%, followed by storage (+22.9%) and retail (+10.4%). On a sector basis, industrial PSF pricing has climbed 88.5% since late 2019, the most of any major property type, while office PSF is up just 36.6% over that period. The median age of traded multifamily properties also skewed much older (61 years) than office (39 years) or hospitality (36 years), showing investor appetite for both new and value-add assets.
Deal Size and Sector Dynamics Evolve
The market’s tilt toward larger transactions is clearest in the $10M+ bracket, which hit its highest share in over three years. Deals in the $1M–$10M range, however, still make up 38.6% of value, with sub-$1M trades accounting for just 11%. Within retail, mid-range deals ($1M–$10M) dominate, representing 54.5% of volume, whereas industrial, multifamily, and office saw a majority of volume from $10M+ deals.
A closer look at property age and pricing reveals that post-2010 office and retail properties command major price premiums—44.6% over 2000s-built office and a 161.5% jump for new versus pre-1970 retail. Yet, older retail outperformed on a growth basis, posting a 17.7% annual price increase. Multifamily’s highest PSF values were paradoxically found in 1980s stock, while post-2010 assets grew fastest year-over-year but remain priced below pre-1970 properties in absolute terms.
Asset Pricing Skyrockets in Select Niches
Median PSF trends highlight the market’s strongest asset classes. Altus Group’s Q1 2026 data shows industrial reached $110/SF, up 11.8% year over year. Retail climbed to $142/SF, while multifamily hit $150/SF. Both sectors posted gains above 8%. Storage led all property types at $91/SF, rising 22.9% annually. Automotive retail followed with 14.0% growth. Warehouse and distribution assets gained 12.8%. Office pricing reached $137/SF, up 8.2%, as larger transactions returned and deal activity improved.
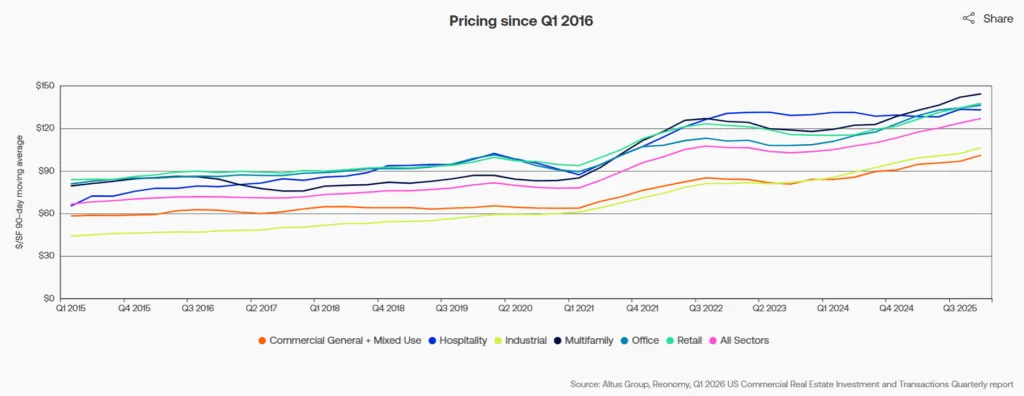
Deal sizes grew across every major property sector. Multifamily led with an 18.7% increase. Industrial followed at 15.7%, while retail rose 15.5%. Hospitality posted the weakest annual price growth at 3.7%. The data suggests investors favor larger deals and higher-quality assets. They continue targeting markets with durable demand and stronger long-term fundamentals.
Why It Matters
Altus Group’s Q1 2026 report shows liquidity and price growth concentrating in major property sectors. Large assets continue attracting capital. Deals above $10M now account for more than half of transaction value, marking the longest stretch since 2022.
Investors have increasingly turned to CRE as an inflation hedge. Industrial and retail lead that shift, posting annual price gains of 11.8% and 10.4%, respectively. At the same time, investors place greater emphasis on property age and operational flexibility. Newer office and retail assets command wider pricing premiums. The gap between older and newer properties continues to expand. That trend is especially clear in multifamily and retail, where growth and value-add investors remain active. Long-term transaction data also shows capital steadily shifting toward sectors with stronger income growth and operational flexibility.
Altus Group’s data points to a continued flight toward quality. It also suggests limited distress among core assets despite tighter lending conditions. Still, recovery remains uneven. National CRE pricing rose 8.7% year over year, but some sectors lag. Hospitality and big-box retail trail most major property types. These performance gaps reinforce the importance of portfolio positioning as market conditions evolve.
What’s Next
Looking ahead, Altus Group’s data suggests competition for institutional-quality assets will remain fierce, especially as investors seek scale and stability. The sustained rebound in $10M+ deals could prompt more listings of mature assets and drive further price appreciation in top-performing sectors.
With pricing power consolidating in industrial, retail, and multifamily, investors will likely keep flocking to these segments, though sector-specific risks—such as office obsolescence or uneven multifamily rent growth—are not fully reflected in headline numbers. Watch for continued increases in median deal size and PSF through 2026, particularly as market participants reposition portfolios ahead of the next rate cycle.