


- US CRE transaction value increased across apartments, industrial, office, and retail sectors for the 12 months ending March 2026.
- Office saw the largest year-over-year jump at 44.4%, led by Manhattan and a sharp rebound in San Francisco.
- Deal flow growth signals a broad market recovery, but leading metros vary depending on asset class and investor appetite.
Broad-Based Deal Growth Returns
S&P Global reports that US commercial real estate transaction value is on the upswing again, according to Real Capital Analytics data for the 12 months ending March 31, 2026. The sector logged growth across all major property types—apartments, industrial, office, and retail—compared with both the previous 12-month period and full-year 2025.
This broad gain contrasts with the deal stagnation seen in prior years as higher interest rates and economic uncertainty froze many investors out of the market. Now, with more capital returning, the current figures show distinct regional winners and major asset class rebounds. According to RCA, each sector outperformed its year-ago counterpart, highlighting renewed conviction among buyers and sellers.
Get Smarter about what matters in CRE
Stay ahead of trends in commercial real estate with CRE Daily – the free newsletter delivering everything you need to start your day in just 5-minutes
The Details
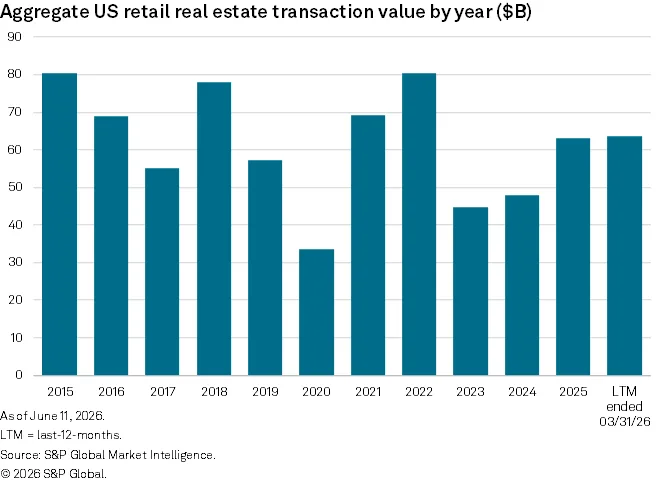
Aggregate US apartment transaction value reached $165.71B, up 7.4% from the prior year. Industrial deals hit $111.45B, marking a 16.8% increase. Office transactions surged 44.4% year over year to $81.79B—the sharpest sector gain—and retail climbed 29.8% to $63.65B. Major markets stand out regionally.
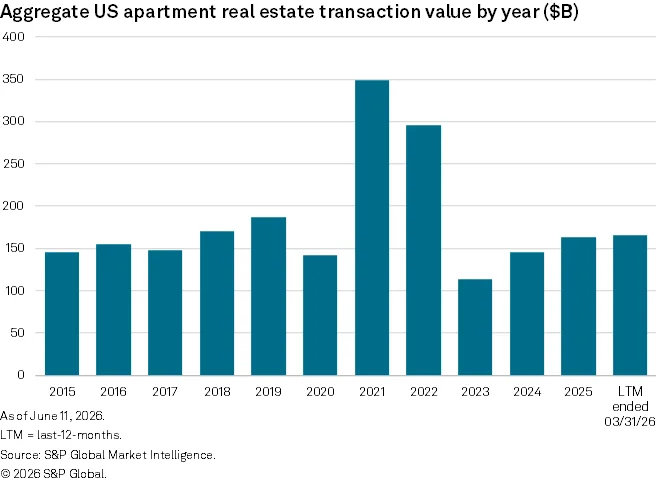
In multifamily, Dallas led with $9.44B in deals despite a 10.5% slip from the previous year, while Atlanta and Houston posted surges of 25% and 38.6%, respectively. Dallas also captured the industrial top spot, with $7.27B in transactions. For office, Manhattan’s $11.85B set the pace, and San Francisco’s rebound (up 268.5%) was dramatic. Los Angeles led in retail at $3.39B, followed closely by Houston and Dallas.
Volume Returns to Top Metros
The latest figures reflect a reshuffling among leading metros by deal volume. Dallas dominated both multifamily and industrial, but its multifamily deal value slipped year over year. Meanwhile, rising Sun Belt metros—Atlanta and Houston—posted outsized apartment gains, while industrial deal activity kept migrating to logistics-heavy markets. Office trends showed a clear coastal resurgence: Manhattan and San Francisco posted robust volume increases, bucking the national narrative of office malaise.
That momentum aligns with a broader rebound in property sales volumes seen across major US markets this year. In retail, Los Angeles retained its crown, though Houston and Dallas ran a close second. Average cap rates drifted higher across sectors—5.3% in Dallas apartments, 5.5% for industrial, and 6.3% for Manhattan office—as investors priced in higher risk, but rising deal flow suggests growing comfort with new pricing benchmarks.
Why It Matters
The data from Real Capital Analytics indicates a market finding its footing after a turbulent stretch. With total US property transaction value climbing in every major asset class, institutional capital appears willing to transact at new valuations, even as cap rates edge up. Office’s 44.4% year-over-year jump in transaction value is especially notable, signaling thawing in a sector often positioned as distressed. San Francisco’s 268.5% gain in office deal value is a stark reversal from steep declines suffered post-2020. In apartments and industrial, Sun Belt metros like Atlanta and Houston continue to attract outsized inflows, reflecting demographic and supply chain pivots, while established gateway markets grapple with price resets.
Deal growth in retail (up 29.8%) offers further evidence that appetite for well-located strip centers and urban retail is rebounding, even if volume remains below past peaks in coastal cities. Higher cap rates—6.0% on retail, per RCA—underline investor selectivity and a recalibration of risk expectations. As economic uncertainty lingers, the fact that all four property types beat both the prior LTM and 2025 totals is a signal to market participants: sidelined capital is returning, and distress-driven price discovery is giving way to renewed confidence in fundamentals. The pace and geography of new deals will be closely watched to gauge whether this marks a broad-based recovery or a rotation toward resilient submarkets and asset classes.
What’s Next
If deal momentum sustains, more investors could return to the market in the second half of 2026, helping narrow the bid-ask gap and further normalize transaction volume. Watch for continued Sun Belt outperformance in apartments and industrial, while coastal markets seek to extend gains in office and retail as macro risks moderate. RCA data in Q2 and Q3 will reveal if transaction growth persists or hits another pause amid economic headwinds. For now, US CRE deal value growth gives the industry its strongest recovery signal since pre-pandemic highs.