





- US bank real estate loan balances grew to $6.14T by Q1 2026, per CRED iQ data.
- Multifamily lending posted a 53% increase since 2019, the fastest percentage growth among major categories.
- Absolute growth was largest in residential and core CRE, adding over $440B each since 2019 and reshaping bank balance sheets.
Lending Composition Evolves Since 2019
CRED iQ Research reports that the landscape for US bank real estate loans has shifted markedly between Q1 2019 and Q1 2026. Loan books, totaling $6.14 trillion, now reveal pronounced segmental growth patterns, with multifamily registering the highest percentage gain—up about 53%—despite its relatively smaller base compared to traditional residential lending.
At the same time, core CRE and residential categories accounted for the most significant absolute increases in loan books, each adding well over $440B. These changes underpin the way major FDIC-insured banks have absorbed real estate risk across different property types during an extended period of market flux.
Get Smarter about what matters in CRE
Stay ahead of trends in commercial real estate with CRE Daily – the free newsletter delivering everything you need to start your day in just 5-minutes
The Details
Residential loans remained the largest category in Q1 2026, totaling $3.10 trillion across bank real estate balances. They represented approximately half of all outstanding balances. Core CRE ranked second at $1.92 trillion, followed by multifamily at $665B. Construction and development loans totaled $453B.
Growth indices, benchmarked to Q1 2019, show that multifamily climbed to 153, representing a 53% increase. Core CRE reached 132, reflecting 32% growth, while construction and development rose 28% to 128. Residential lending increased more modestly, reaching an index of 117, or 17% growth.
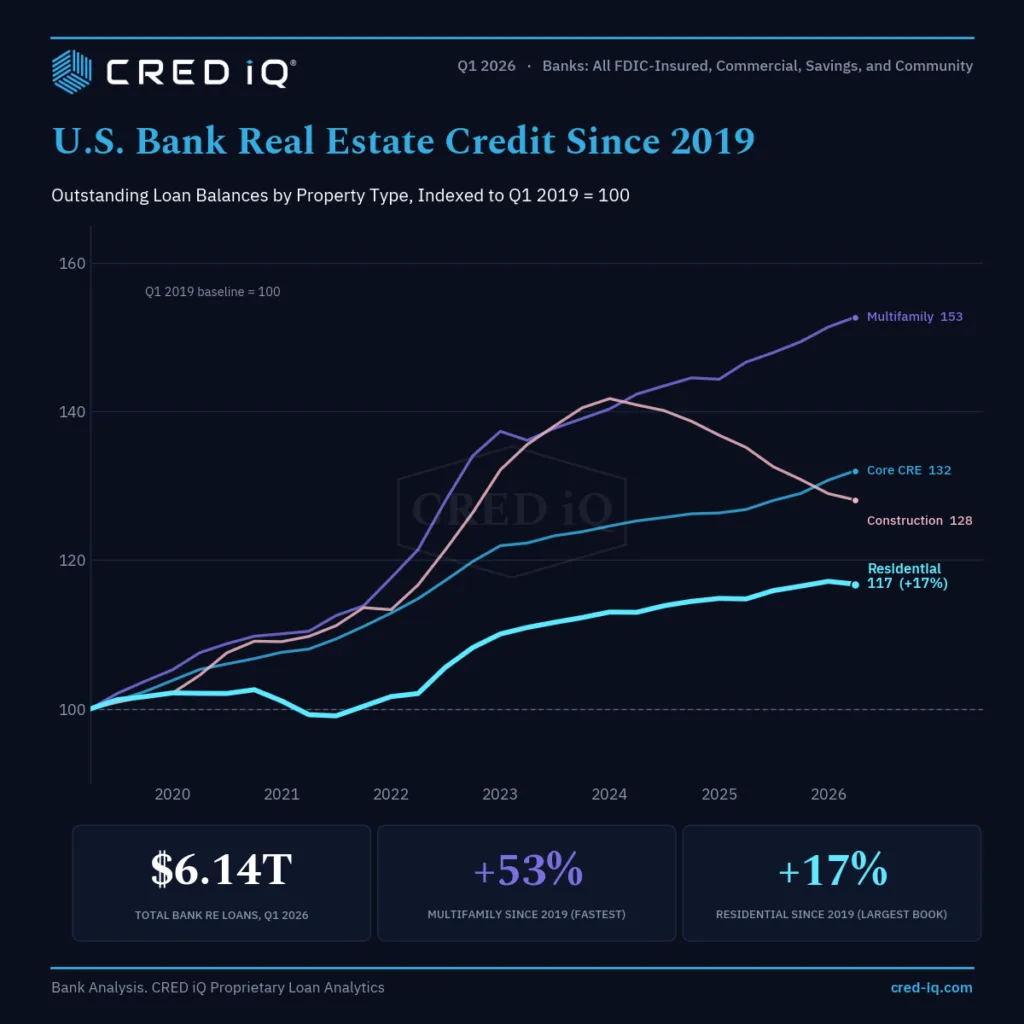
However, the absolute dollar figures tell a different story. Residential balances increased by roughly $445B, while core CRE added approximately $467B. Both categories exceeded multifamily’s roughly $229B increase, despite multifamily posting the strongest percentage growth.
Construction and Development Cycles Moderate
Construction and development lending recorded the sharpest fluctuations among the major categories. Its index peaked at 142 in 2024 before declining to 128 by Q1 2026.
The pattern reflects aggressive expansion followed by a meaningful pullback. Higher borrowing costs and tighter credit standards likely contributed to concerns about risk and slower development pipelines.
Other lending segments followed steadier and more consistent growth patterns. By contrast, construction lending surged after the pandemic before macroeconomic pressures slowed that momentum.
Longer-term data showed no comparable reversal before 2019. That distinction makes the recent construction cycle a notable post-2019 development.
Why It Matters
These shifts show how banks have adjusted their risk appetite and lending exposure across property sectors over seven years. According to CRED iQ, multifamily lending recorded the fastest proportional growth despite remaining the third-largest segment. However, bank multifamily delinquencies recently reached a 13-year high, underscoring rising credit risks within the sector.
Strong rental housing demand likely supported that expansion. Banks may also have maintained greater confidence in multifamily credit performance during periods of broader market turbulence.
Meanwhile, core CRE and residential portfolios absorbed most new exposure in absolute dollar terms. Core CRE added $467B, while residential balances increased by $445B.
That scale carries significant implications for the banking system. Residential mortgages still account for roughly half of all bank real estate holdings.
As a result, residential credit performance can shape risk across individual institutions and the broader financial system. Core CRE also remains a substantial source of balance-sheet exposure.
Construction and development lending followed a distinctly different path. Banks expanded lending quickly before giving back part of that growth by 2026.
The decline suggests lenders have become more cautious or responded to weaker project starts. Higher financing costs may have reinforced that shift.
Banks continue reassessing their portfolios amid changing market conditions and regulatory pressures. These figures show where real estate credit exposure has accumulated since 2019.
They also reveal how lending appetite has evolved across sectors. Percentage growth alone does not capture the full scale of balance-sheet expansion.
What’s Next
Banks have reallocated real estate credit in ways that increasingly define their risk profiles across different property categories. Multifamily growth may encourage lenders to watch underwriting standards and adjust pricing as market conditions evolve.
Higher-for-longer interest rates could further compress margins and pressure property values. Those conditions may also influence future lending decisions across several real estate sectors.
Meanwhile, the reversal in construction lending suggests future expansion could proceed with greater discipline. Banks may prioritize stronger projects and maintain tighter credit standards.
Regulators will likely continue scrutinizing large CRE and residential exposures. Banks, investors, and regulators must also track origination trends against balance-sheet retention.
Those comparisons will help clarify how lenders manage risk as the economic cycle progresses. They will also reveal where future real estate credit growth concentrates.