







- The Trepp Property Price Index indicates CRE price stabilization in Q1 2026, but with notable differences by sector and asset size.
- Industrial and retail assets held up, while multifamily pricing fell and lodging remained the weakest segment per Trepp’s data.
- Large-scale institutional assets still face slow price discovery, suggesting the recovery is not yet broad-based.
Sector Divergence Shapes CRE Pricing Recovery
Commercial real estate prices showed early signs of stabilization in Q1 2026, but the recovery varied significantly across sectors and deal sizes. According to Trepp’s latest Property Price Index (TPPI), the widespread repricing that followed the post-2022 rate hikes has given way to narrower, sector-specific movements. While steady economic growth and several late-2025 rate cuts reduced market anxiety, prices across different CRE assets continue to chart divergent paths. The economic landscape remains defined by persistent inflation, a moderately cooling labor market, and emerging challenges such as oil price volatility and shifts in private credit and AI-driven capital deployment.
Context from the TPPI is increasingly critical: as more data points enter the Trepp system, market participants are gaining a clearer—if still uneven—picture of sector health and recovery timing. These nuances are especially relevant as property values and transaction velocity across US markets diverge, highlighting risks and opportunities for investors, lenders, and operators navigating the range-bound pricing environment in 2026.
Get Smarter about what matters in CRE
Stay ahead of trends in commercial real estate with CRE Daily – the free newsletter delivering everything you need to start your day in just 5-minutes
The Details
The Trepp Property Price Index leverages repeat sales data to monitor CRE price movement, drawing on 8,888 new transactions added in Q1 2026. The index offers both equal-weighted (EW) and value-weighted (VW) perspectives: EW reflects performance across all asset types and sizes, while VW reflects outcomes for larger, higher-value deals. In Q1, the EW TPPI composite index rose modestly by 0.09%, now 4.45% above June 2022 levels, indicating stabilization among small and mid-sized properties.
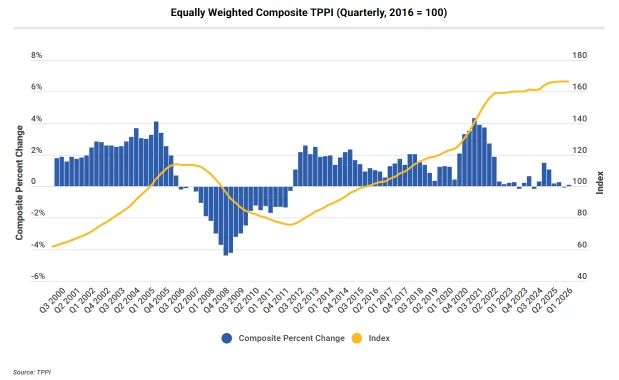
The VW index inched up just 0.07% for the quarter and is only 0.03% above its Q1 2025 mark. But at 7.53% beneath its June 2022 level, it signals ongoing stretched pricing for the largest assets. This mixed performance supports the view that most broad repricing has run its course in the mid-market, while institutional players continue to tread carefully.
Property Types Diverge in Pricing Path
Sector-level performance in Q1 2026 showed significant dispersion.
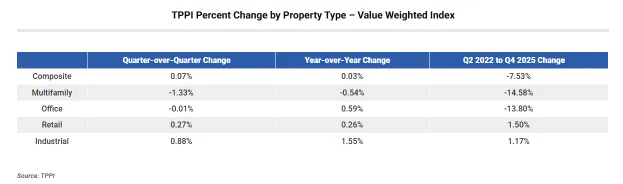
Multifamily assets suffered further declines: EW fell 0.77% quarter-over-quarter and VW dropped 1.33%, maintaining a 14.58% deficit vs. June 2022. In a shift, multifamily overtook office as having endured the steepest post-pandemic VW loss. Retail, meanwhile, displayed relative resilience, with gains of 0.08% EW and 0.27% VW, moving values slightly above 2022 peaks. Industrial pricing continued upward—EW rose 0.33% and VW 0.88%—reflecting resilient demand and modest new supply.
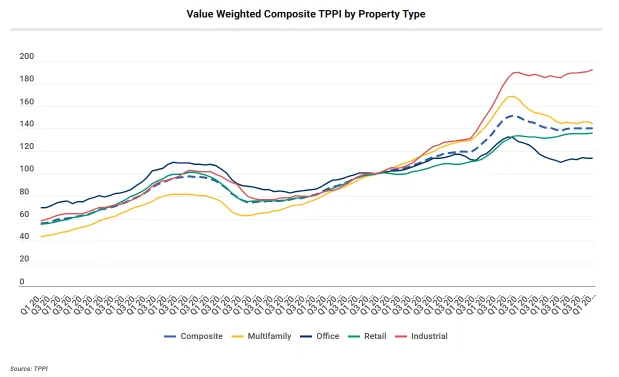
Office saw a 1.10% EW boost but remained flat for VW at -0.01%, highlighting the stark difference in price recovery between small vs. large office transactions. Lodging recorded a slight 0.15% EW gain but remains 12.50% below June 2022 and the weakest segment overall.
Why It Matters
The Q1 2026 TPPI data reveals a CRE landscape that’s stabilizing, yet inherently uneven. The EW index’s recovery above June 2022 levels shows that smaller and mid-tier deals have largely absorbed recent monetary shocks. This points to renewed buyer confidence at lower price points. It also suggests private capital and non-institutional lending are providing liquidity where banks and large funds still hesitate. A similar pricing reset is also reshaping institutional CRE strategies as capital targets stronger, clearer-performing assets.
However, the VW index still lags pre-rate-hike highs. That weakness reflects continued caution among institutional investors and lenders. Larger deals clear slowly because financing remains tight and price discovery stays uneven. Office and multifamily also face lingering questions about long-term operating strength. Multifamily has now passed office as the biggest VW price laggard since June 2022. That shift points to late-cycle corrections and pressure on once-premium, rate-sensitive assets.
Meanwhile, industrial and retail continue to show steadier values. E-commerce demand and limited new supply keep supporting industrial pricing. Retail has also gained resilience after years of repricing and leaner development. Still, macro risks could test both sectors. Oil volatility and AI-driven disruption could eventually affect tenants and pricing power. Trepp’s analysis shows managers and lenders must underwrite by sector and scale. They can no longer rely on one broad CRE recovery narrative.
What’s Next
Market participants now watch TPPI for signs that stabilization can turn into a broader rebound. They also want to know whether sector divergence will persist. Trepp expects stronger data partnerships to deliver more granular insights. That should matter as more transactions enter its system from emerging US regions.
For CRE professionals, the broad takeaway remains clear. Expect asset-level and geographic gaps to define 2026. Large institutional assets may take longer to reprice because financing remains tight and rate uncertainty persists. Meanwhile, energy market swings, AI-driven volatility, and slow capital markets normalization could shape CRE pricing next. For now, the message remains measured optimism. However, investors should stay selective by sector and underwrite with caution.