







- Investors bought about 224,000 homes in H1 2026, down 7.0% and the weakest first-half total since 2020, and accounted for 10.7% of all purchases.
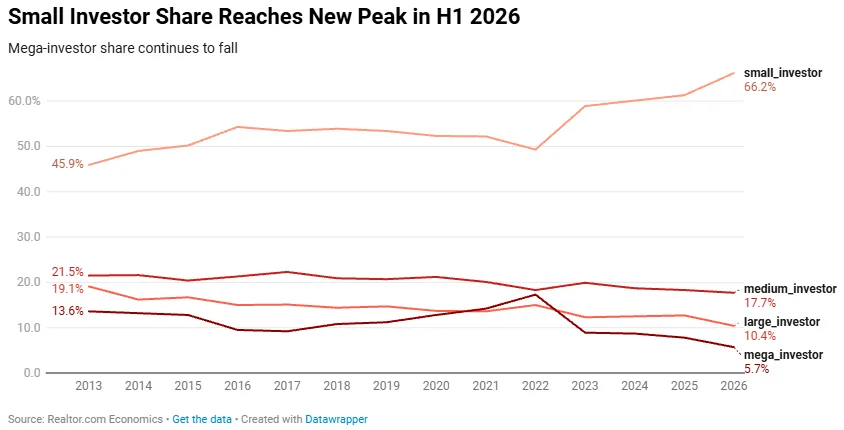
- Small investors, defined as entities with fewer than 10 purchases, supplied 66.2% of investor buying, the highest share in 15 years, while mega-investor purchases are down nearly 70% from 2021.
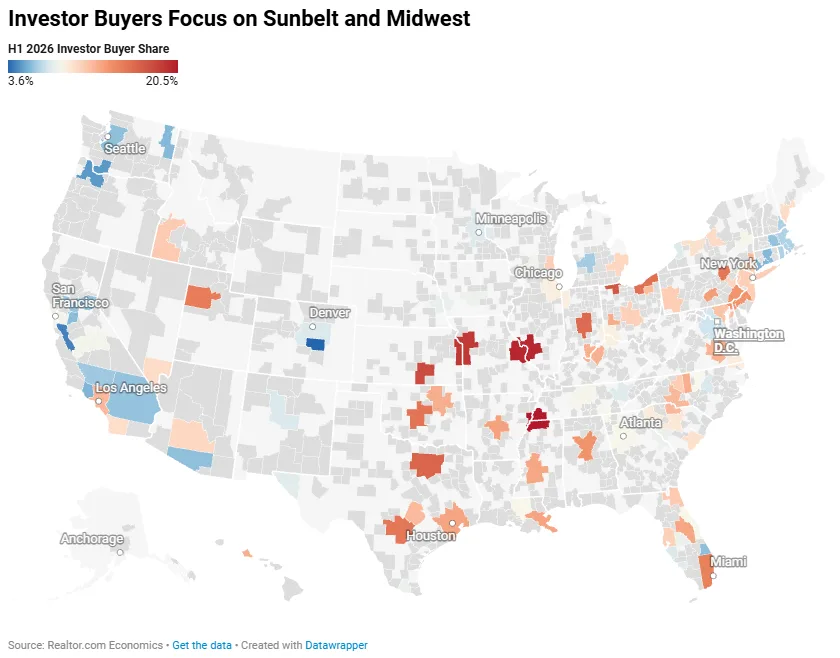
- Investors still pay cash far more often than other buyers, at 55.5% versus 30.0%, and they cluster in affordable Midwest and Sun Belt metros led by Memphis and St. Louis.
Investor home purchases dropped 7% in H1 2026 as small buyers grabbed a record share and big institutions stepped back, according to Realtor.com’s midyear Investor Report.
Investors bought roughly 224,000 homes, the lowest H1 volume since 2020, and made up 10.7% of purchases. A year earlier, the share was 11.0%.
Get Smarter about what matters in CRE
Stay ahead of trends in commercial real estate with CRE Daily – the free newsletter delivering everything you need to start your day in just 5-minutes
Big Buyers Step Back
Mega-investor buying has shrunk almost 70% from H1 2021, and large-investor buying is off about 40%. Both groups were net sellers this half.
Mega-investors bought about 12,700 homes, versus 148,000 for small investors. They account for 5.7% of investor activity, down from roughly 18% at the 2021 and 2022 peak.
Realtor.com ties some of the retreat to uncertainty over a proposed ban on large investors. With the 21st Century Road to Housing Act now law, it says bigger buyers could return in the second half.
Cash Still Rules
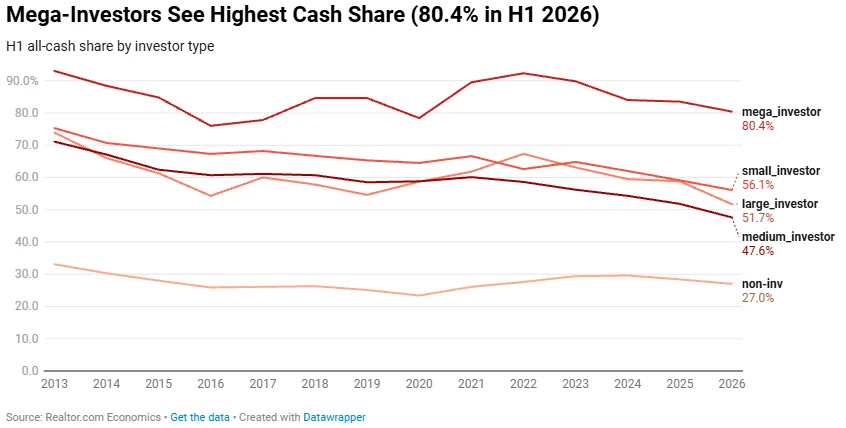
Investors paid all cash on 55.5% of purchases, versus 30.0% across the market. A year ago the figure was 59.6%, and in 2021 it peaked at 67.9%.
Mega-investors paid cash 80.4% of the time, small investors 56.1%. Roughly one in four all-cash deals now involves an investor, down from one in three at the 2022 peak.
Financing is pricey. Realtor.com says mortgage rates broke through 7% in recent weeks, a level not seen since January 2025, and its latest reading is 7.4%. In February they briefly slipped just under 6%, which pulled some buyers back in and trimmed the investor share.
Where They Buy
Memphis tops the list at a 20.5% investor share, followed by St. Louis (20.0%), Kansas City (19.1%), Wichita (18.0%) and Toledo (17.3%). Dallas-Fort Worth at 16.5% and San Antonio at 15.3% also rank in the top ten.
Prices explain the pull. In the ten most investor-heavy metros, the median investor purchase was $174,000, far below the $295,000 national figure. Midwestern markets offer affordability, while the Sun Belt offers inventory and softer prices.
Mega-investors have the biggest footprint in Texas (1.9% of purchases), Nevada (1.8%) and Georgia (1.3%). In Missouri, Montana and Mississippi, small investors alone account for more than 10% of purchases, so buyers there may feel the competition most.
Zoom Out
Rents support the buy-and-hold case. Cotality’s index showed single-family rents up 2.0% from a year earlier in August, a sixth straight month of faster annual gains, with Chicago leading at 4.9%.
Why It Matters
Small investors paid a median $295,000, 22.4% below the $380,000 non-investor median. That puts them in the same price band as entry-level buyers.
Sellers are slowing too. Investors sold 196,000 homes, down 5.5% and the fewest in an H1 since 2023, and they made up 9.4% of all sales.
The typical investor purchase price rose 3.5%, outpacing the 1.9% market gain, so the gap with non-investor prices is narrowing.
Investors remain more active than typical buyers. Their purchases run 4.2% above pre-pandemic H1 levels, while non-investor purchases are 21.6% below.
What’s Next
Watch the large and mega buyers. If policy clarity brings them back, the small-investor share could slip from its record, and cash-heavy bidding could return to the cheapest metros.