



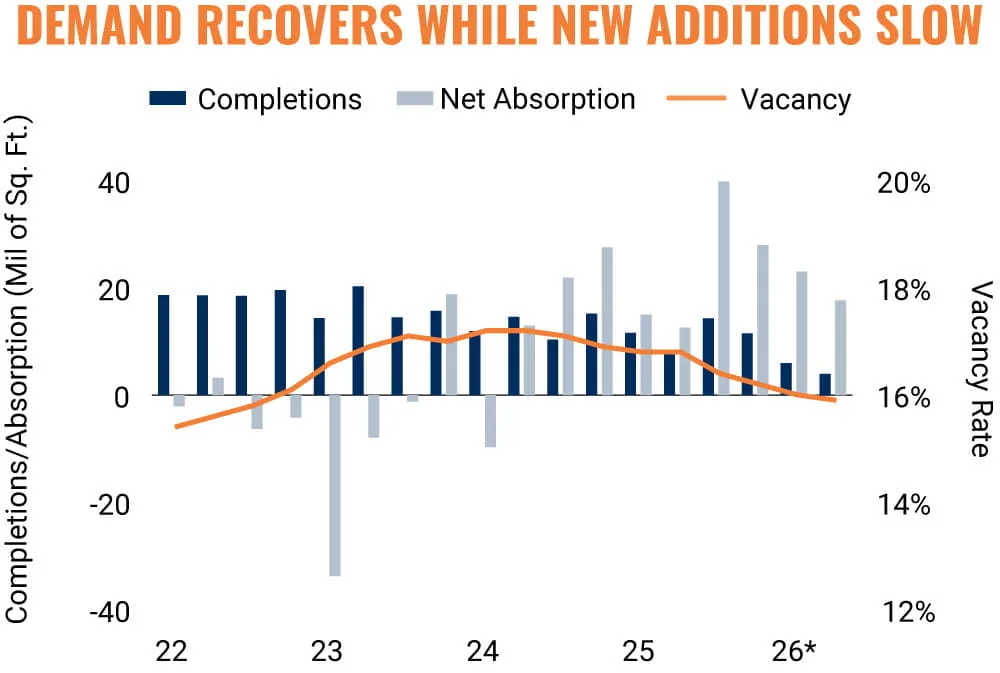
- US office vacancy hit 15.8% in June 2026, down from the early 2024 peak as net absorption improved for the ninth straight quarter.
- Net absorption and leasing are concentrating in gateway and Sun Belt markets, while Midwest and specialized-industry cities lag.
- New office supply remains limited, which, alongside tenant demand in specific regions, is helping rebalance some market fundamentals.
Supply Constraints Signal a Shift
After years of supply outpacing demand, new US office deliveries have dropped sharply. Marcus & Millichap’s 3Q26 outlook shows just 9.9M SF delivered during the first half of 2026. That marked the lowest midyear total since at least 2000.
Construction has steadily retreated since the pandemic. Developers have responded to weaker white-collar job growth and persistent uncertainty around corporate space needs. This scarcity reverses the pre-2020 building boom and creates a firmer floor for landlords in competitive submarkets.
Get Smarter about what matters in CRE
Stay ahead of trends in commercial real estate with CRE Daily – the free newsletter delivering everything you need to start your day in just 5-minutes
The Details
The nationwide office vacancy rate reached 15.8% in June 2026. That was 140 basis points below its early 2024 peak. However, vacancy remained well above the pre-pandemic five-year average of 12.7%.
Source: Marcus & Millichap
National net absorption recorded its ninth consecutive positive quarter in Q2 2026. First-half absorption reached 40.7M SF, the strongest first-half performance since 2019. Still, 10 major markets, mostly in the Midwest, reported declining demand. Class A properties also remain more challenged than Class B and C assets.
Gateway Markets Drive Recovery
Established office hubs recorded the strongest leasing velocity and absorption gains over the past year. Marcus & Millichap highlighted the San Francisco Bay Area, New York City, and Southeast Florida. Technology, finance, and business services tenants increasingly target these markets for their deep global talent pools.
Dallas is also attracting more institutional office capital as investors increasingly view it alongside traditional gateway markets. Meanwhile, Philadelphia, Chicago, Washington, D.C., and San Diego experienced slower improvements or continued space reductions. Government, healthcare, and life sciences exposure weighed on several of these markets. Atlanta, Phoenix, and major Texas metros posted solid leasing activity. However, deal sizes remain smaller than pre-2020 norms.
Why It Matters
The uneven US office recovery shows how location and tenant mix increasingly determine asset performance. Hybrid work remains widespread but continues supporting demand for dedicated office space. Rising attendance has helped offset sluggish white-collar employment growth.
Office-using employment fell by 12,000 through July 2026, while overall payrolls increased by 426,000. Limited construction has provided landlords with additional breathing room. New deliveries at two-decade lows have also helped compress vacancy among well-located properties.
Gateway cities with global connectivity and deep talent pools remain positioned to outperform. Tech and finance tenants continue concentrating in these markets. Cities exposed to slow-growth industries or government tenants face greater demand challenges. CoStar data shows Class A vacancy still trails improvements across Class B and C properties.
What’s Next
Historically low construction pipelines could support further national vacancy compression if demand holds. However, office-using job losses remain a major headwind after four consecutive years of declines. Diversified markets with innovative employers could benefit most if white-collar hiring stabilizes.
Through 2027, lease-up activity and occupancy gains will remain highly dependent on individual markets and buildings. Investors must increasingly evaluate local demand drivers, tenant quality, and operator execution. These differences will test both asset strategies and the durability of the broader office recovery.