






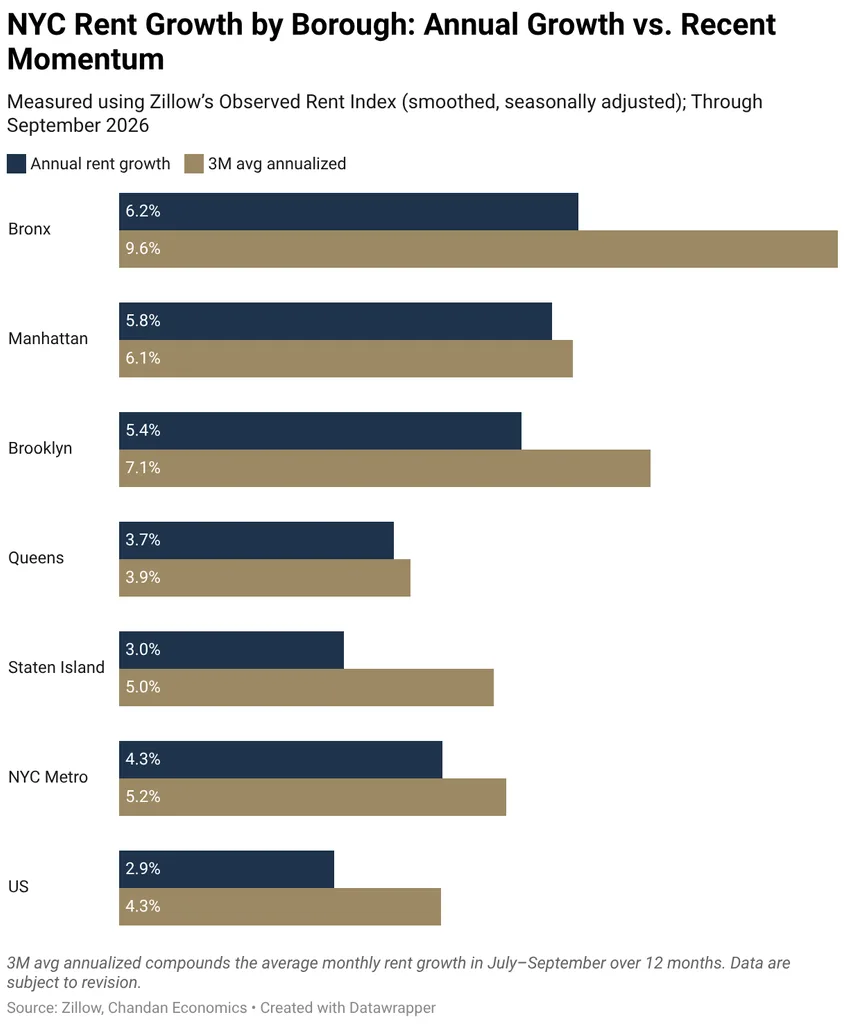
- NYC rents rose 4.3% year over year through September, beating the 2.9% national pace, and all five boroughs outran the U.S. average.
- The Bronx led at 6.2% annually and 9.6% on a three-month annualized basis, ahead of Manhattan at 5.8% and Brooklyn at 5.4% for the year.
- Citywide rental inventory fell 15.3% in September, and recent gains in Inwood, Bed-Stuy and Crown Heights show pricing pressure reaching beyond the priciest neighborhoods.
NYC rent growth is outrunning the national pace in all five boroughs, and the Bronx is setting the tempo, according to Chandan Economics’ October rent monitor.
Rents across the metro climbed 4.3% in the year through September, against 2.9% for the U.S. The analysis runs on Zillow’s Observed Rent Index.
Get Smarter About What Matters in New York
Subscribe to our free newsletter covering the biggest commercial real estate stories across the five boroughs — delivered in just 5 minutes.
Bronx Sets the Pace
The Bronx posted the biggest annual gain at 6.2%. Manhattan came next at 5.8%, then Brooklyn at 5.4%.
Queens came in at 3.7%. Staten Island’s 3.0% was the lowest of the five, yet it still beat the national figure.
Recent Momentum Runs Hotter
Look at the latest three months, annualized, and the picture speeds up: 5.2% for the metro versus 4.3% nationally.
Brooklyn hit 7.1% and Manhattan 6.1%, while the Bronx led at 9.6% and Staten Island reached 5.0%. Queens, at 3.9%, was the only borough trailing the U.S. rate, though it is also accelerating from its annual pace.
In every borough, the recent pace beats the year-over-year gain. The Bronx and Staten Island show the largest spreads.
Thin Supply Backs It Up
Scarcity helps explain the staying power. StreetEasy put citywide rental inventory 15.3% lower in September. Manhattan listings fell 16.3% and Brooklyn’s dropped 18.4%.
Other data points the same way. CRE Daily’s brief on Brooklyn apartment leasing cited Corcoran Group figures showing Brooklyn’s average rent up 5% to $4,300 while active listings fell 25%.
Beyond the Priciest Blocks
Chandan flagged Washington Heights, Inwood, Bedford-Stuyvesant and Crown Heights as areas where recent gains exceed annual ones.
That suggests the pressure isn’t confined to the city’s most expensive ZIP codes.
Why It Matters
Market-rate landlords are operating with little slack, which supports pricing power at renewal and lease-up. With the city’s rent freeze holding stabilized apartments flat, market-rate units are the likelier source of rent growth.
Buyers feel the squeeze too. CRE Daily’s earlier brief on bidding wars found StreetEasy inventory down 5% in August, with Manhattan supply off 11%, so tight supply is showing up in sales as well as rentals.
One caveat: the index covers all residential rentals, including single-family homes, not just apartment buildings. The series is also smoothed and subject to revision.
What’s Next
The monitor comes out monthly, so the next release will show whether the Bronx’s 9.6% surge and Queens’ catch-up hold. Revisions to the smoothed data could shift the picture.