


- FTSE Nareit Office Index landlords post a 36.9% rent premium, with average in-place rents at $62.02/SF versus $45.31/SF for peers.
- Nareit REIT portfolios surpass non-REITs on rent growth, lease term stability, and mark-to-market upside, per CompStak’s analysis.
- This performance gap is driven by a greater concentration in Prime Class A space and shows advantage in quality over quantity for listed office REITs.
REITs Versus Private Giants in Office Landlord Rankings
CompStak’s fourth portfolio benchmarking report, as covered in their latest release, takes a direct look at how FTSE Nareit Equity Office Index constituents stack up against the largest institutional and private office owners in the US. This index, representing 16 publicly traded office REITs—including BXP, Vornado, Kilroy, and SL Green—offers a concentrated view of high-profile US office ownership.
The story isn’t just about size, but strategy. As of April 2026, these REITs combined for a $38.8B equity market cap—only about 2.5% of the full $1.54T US REIT space. The real difference emerges in property mix and lease performance, with Nareit landlords leading multiple critical leasing benchmarks thanks to a prime-centric asset strategy.
Get Smarter about what matters in CRE
Stay ahead of trends in commercial real estate with CRE Daily – the free newsletter delivering everything you need to start your day in just 5-minutes
An Institutional Split Widens
Publicly traded REITs in the FTSE Nareit Office Index face stiff competition from institutional giants like Brookfield, Tishman Speyer, and Hines. However, Nareit-listed portfolios are notably more concentrated in trophy and Prime Class A assets—which explains their higher in-place rent and overall leasing score.
CompStak data shows Class A space constitutes 53.8% of Nareit REITs’ actively leased SF, compared to 38.7% among all other landlords. Exposure to Class B/C is 10.3% in the Nareit camp versus 25.3% for non-REIT peers. This repositioning helps REITs capture tenants at higher rates—while private and institutional groups carry more legacy and lower-tier stock, diluting rent averages and producing a closer concession margin to national norms.
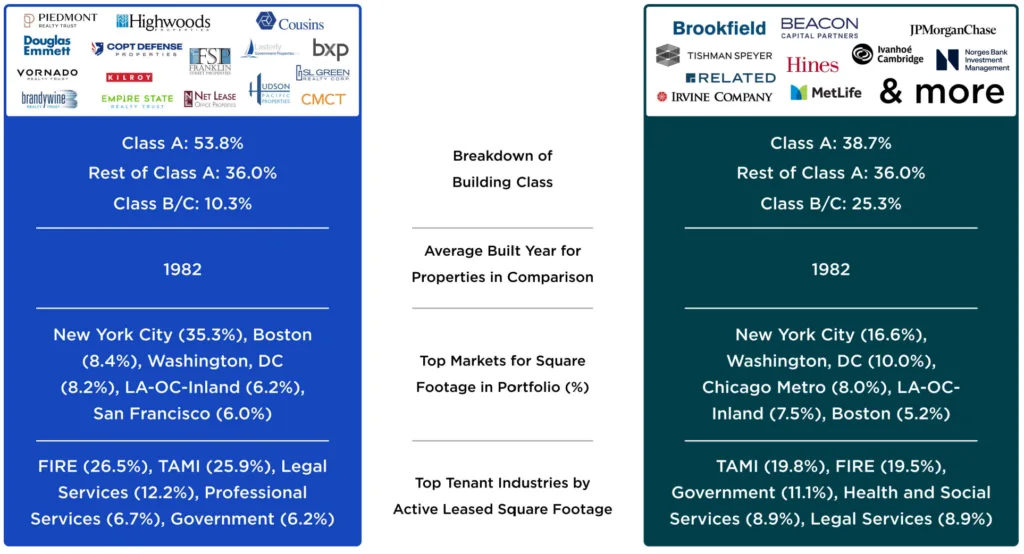
Source: CompStak.
The Details
Nareit REITs’ weighted average in-place office rent sits at $62.02/SF, 36.9% above the $45.31/SF average for non-index peers. Portfolio analysis attributes this advantage directly to a larger Class A share and lower Class B/C exposure. For rent growth since 2019, REITs posted 32.5% gains compared to 24.5% for all other landlords. In terms of leasing flexibility, Nareit portfolios led with a 9.6% mark-to-market rent spread, suggestive of stronger future rent rollups as leases expire.
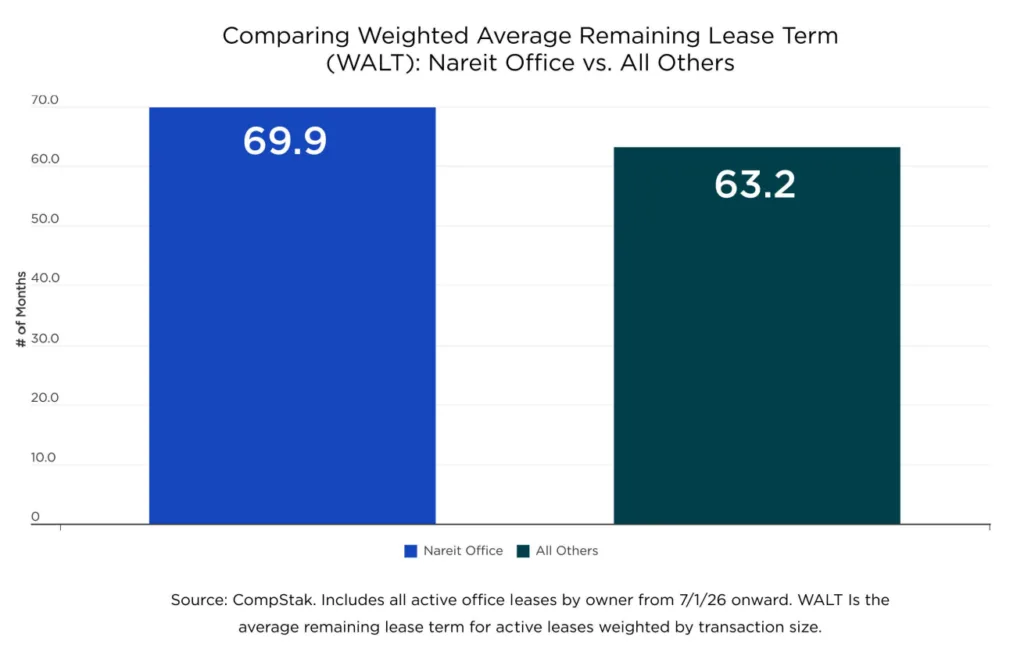
Concession strategy is also in focus: other landlords averaged higher TI allowances ($62.74/SF) and a higher overall concession ratio (15.6%) than Nareit REITs ($55.80/SF and 14.7%, respectively). Lease stability trends favor REITs as well; weighted average lease term (WALT) is 69.9 months for Nareit compared to 63.2 months for all others, indicating a lower risk of near-term rollover.
Rent Premiums and Upside in a Segmented Market
CompStak’s scoring methodology calculates an overall portfolio score of 54.4 for Nareit Office landlords, outpacing their private and institutional peers at 50.0. The market clearly values asset quality: Prime Class A exposure is driving a sizable rent premium in favor of REITs.
Portfolios tracked by CompStak show cities like NYC, Boston, and DC are the dominant markets for both REIT and non-REIT players, but the sector mix diverges. Nareit portfolios are heavier on FIRE (finance, insurance, real estate), TAMI (tech, advertising, media, information), and legal tenants, while non-REITs place more weight on government, health and social services, and legacy corporate users. Despite sector headwinds, the positive mark-to-market spreads for both groups suggest a lag in in-place rents catching up to today’s leasing rates—though REITs have more room for upside as contracts roll.
Why It Matters
The divergence between Nareit REITs and other major landlords underscores how asset quality and capital structure shape portfolio resilience. REITs, with heavier exposure to trophy properties and Class A buildings, continue to command the highest rents and enjoy stronger lease stability. According to CompStak, the average rent for Nareit portfolios stands nearly $17/SF higher than non-REIT competitors, a margin that’s increasingly relevant as hybrid work and tenant downsizing batter commodity office assets. That leasing strength aligns with broader trends showing premium office space continues to secure the highest rents and longer lease commitments across major markets.
Notably, while 2025 saw the FTSE Nareit Equity Office Index post a -14.0% return, underperforming both the S&P 500 and broader Nareit REIT universe, leasing fundamentals remain robust within the core office tranche. These results highlight a familiar bifurcation: REITs can’t escape public market volatility, but their prime-heavy portfolios are less exposed to the distressed tail risks plaguing many older and undifferentiated buildings—especially those outside gateway cities.
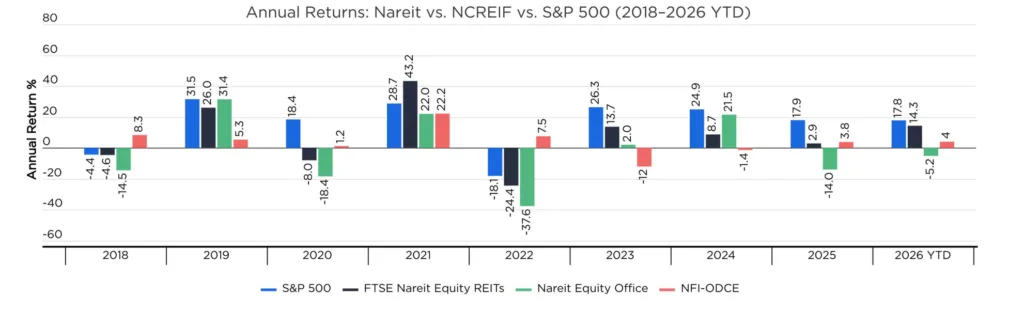
Source: Nareit, NCREIF.
In a market battling record-high vacancy, these leading office REITs continue to attract top-tier tenants seeking modern, amenitized space. The mark-to-market spread is important, too. At 9.6% for Nareit portfolios, compared to 4.6% for all other owners, REIT-owned properties can potentially accelerate rent growth in a recovery scenario, while private and institutional portfolios may find themselves flatfooted.
What’s Next
With the office sector still in flux, the performance gap between REITs and their private competitors could widen. As leases roll and new deals are struck, market observers will be watching whether Nareit landlords continue to outpace the rest of the field on both rents and stability—or if private owners recalibrate by offloading underperforming assets and reinvesting in upgrades.
The next 12-24 months will be critical for both groups. The ability to preserve cash flow, attract quality tenants, and reset market rents will determine which portfolios come out ahead as the sector searches for bottom. Should economic or CRE capital markets conditions improve, properties with trophy and Prime Class A exposure are best positioned to seize new leasing momentum and justify their premium. CompStak’s ongoing benchmarking will provide further clarity as these trends develop.