







- NAR’s new index offers a data-driven lens on commercial real estate demand by metro area, weighted toward industrial and multifamily sectors.
- Sun Belt boomtowns have cooled, while the Carolinas and smaller Southern and Midwest markets are gaining share, per Q2 2026 data.
- Sector-level trends reveal stark contrasts in demand drivers, suggesting CRE opportunities will depend more on local fundamentals than national averages.
A New Benchmark for CRE Demand
The National Association of Realtors (NAR) has debuted its Commercial Real Estate Demand Index, a tool measuring prospective demand across more than 300 US metros by aggregating employment and population trends. Unlike traditional vacancy or absorption metrics, the index weights growth in property-specific economic drivers, giving extra emphasis to surging industrial and multifamily demand since 2022. The aim, according to NAR, is to help industry professionals identify which local economies are set to generate real space requirements before those trends show up in leasing data or rents.
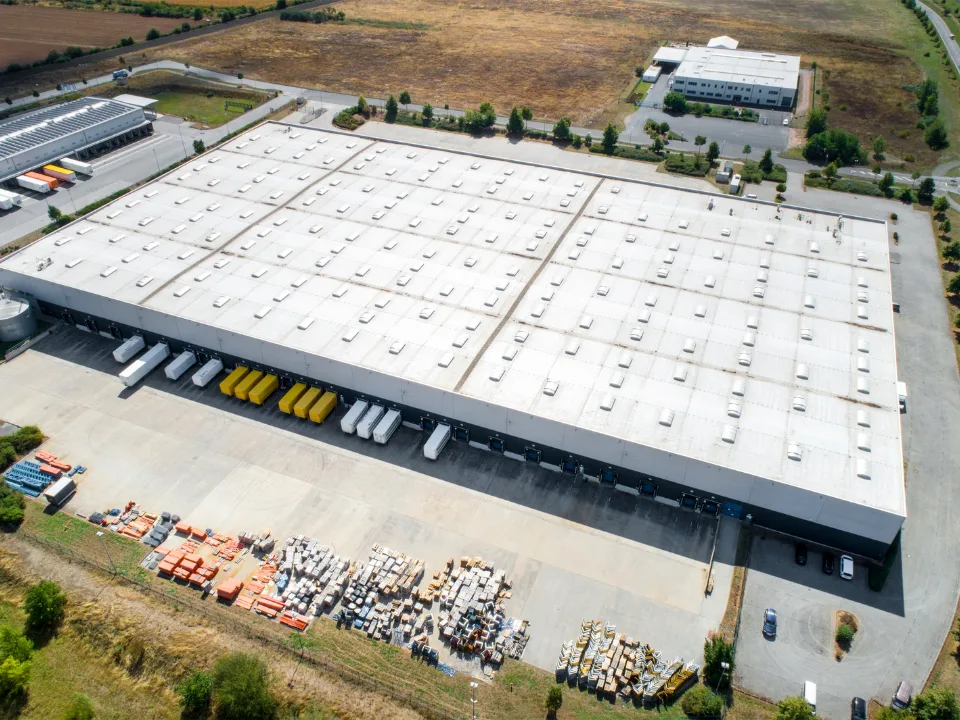
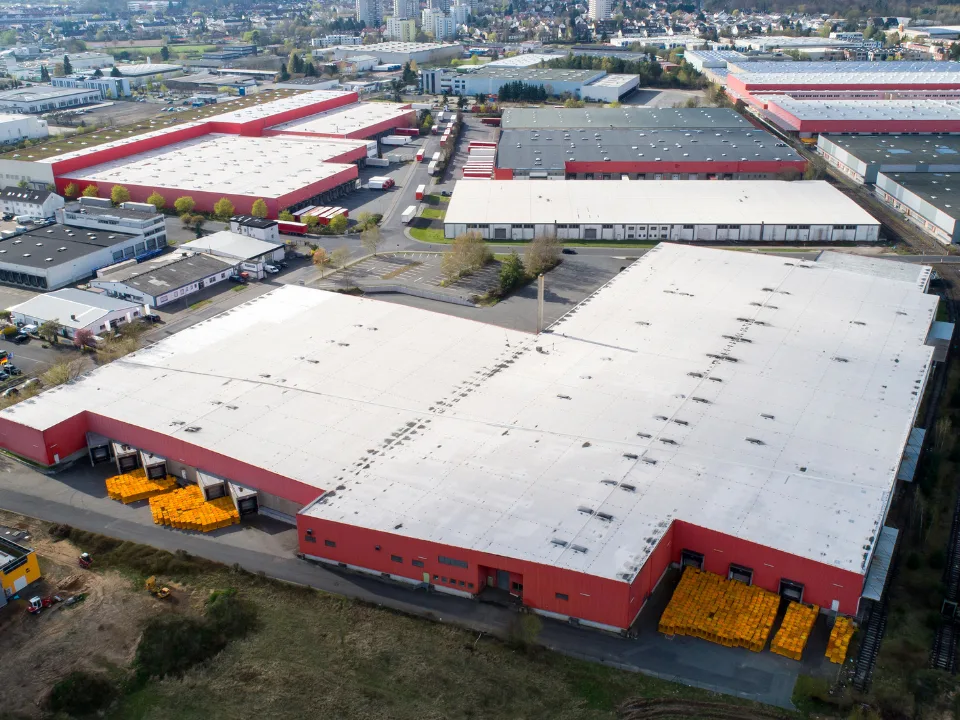
The data-driven approach responds to major shifts since the pandemic, with new patterns of migration, hiring, and sectoral growth unevenly distributed across regions. Industrial and multifamily have led transaction volumes for several years, so the index reflects their increased weight, allowing for sharper forecasting on a local level.
Get Smarter about what matters in CRE
Stay ahead of trends in commercial real estate with CRE Daily – the free newsletter delivering everything you need to start your day in just 5-minutes
Beyond Boomtowns: Changing Momentum
NAR’s index shows that the Sun Belt cities which led the last CRE surge are now returning to the pack. Austin’s overall score sank from 132 in 2022 to 116 by Q2 2026, while Florida metros fell from an average of 115 to 110, and hotspots like Naples, Punta Gorda, and Miami each dropped sharply. In most cases, these markets are still growing, but the white-hot momentum of 2021–2022 has cooled as hiring slowed and migration decelerated.
Meanwhile, the Carolinas have taken the baton. South Carolina claims the top state average at 110, and North Carolina’s Raleigh and Charlotte have both seen steady improvement. Smaller markets in Texas like Waco, Abilene, and Sherman-Denison showed even bigger year-over-year jumps, offsetting slower growth in major Texas metros such as Austin and Dallas-Fort Worth.
The Details
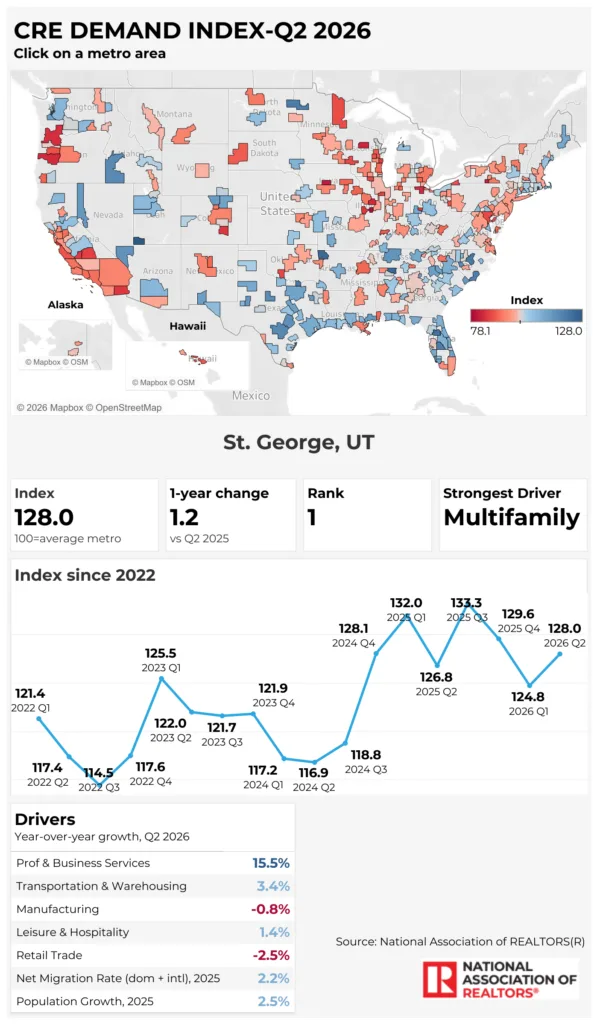
The index tracks four major sectors, weighting each by its recent share of CRE activity: office (22%), industrial (28%), retail (22%), and multifamily (28%). Each sector’s demand is proxied by linked economic measures: office by professional and business services jobs, industrial by manufacturing, transportation and warehousing growth, retail by gains in retail and hospitality jobs, and multifamily by population and net migration. An index score of 100 marks the national metro average, and every 15 points represents a standard deviation above or below.
St. George, Utah leads all metros at 128, driven by best-in-nation office employment growth and robust population gains. Fayetteville-Springdale-Rogers, AR (125) and Huntsville, AL (125) also top the list, with Huntsville leading in multifamily demand and Fayetteville in retail. Smaller markets such as Sherman-Denison, TX and Lakeland-Winter Haven, FL have seen breakouts across multiple sectors, illustrating that size alone is no longer destiny for local CRE momentum.
Sector Leaders Buck the National Narrative
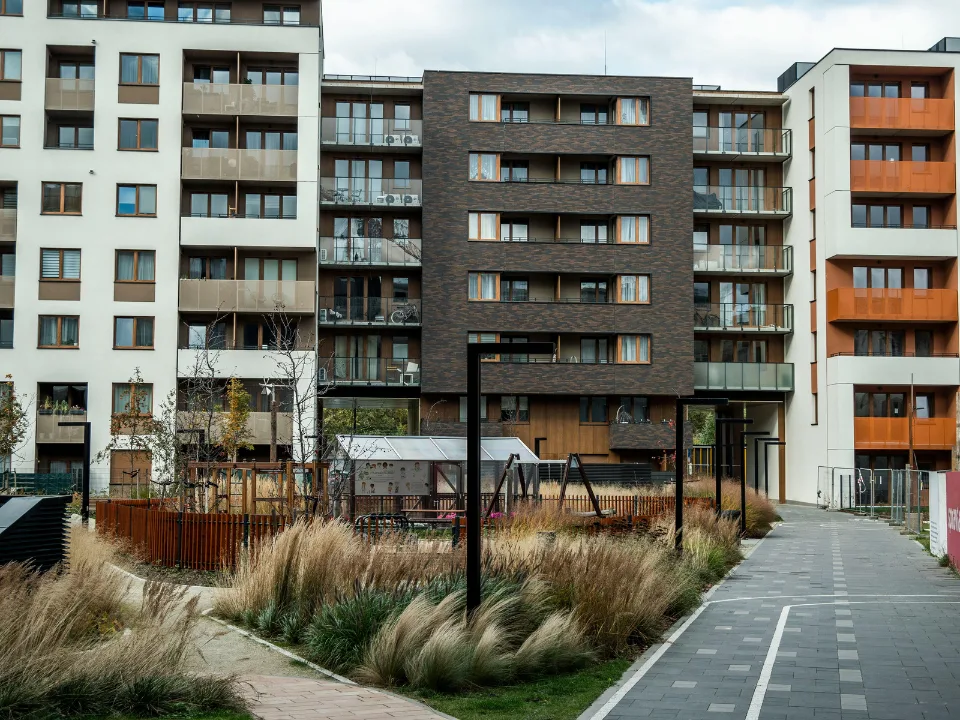
Sector-specific analysis reveals a patchwork of opportunity. Office demand is strongest in smaller metros in Utah, Texas, and North Dakota. Industrial strength is concentrated in unexpected places. Salem, OR, and Fairbanks, AK lead as manufacturing and warehousing employment surges. Fayetteville-Springdale-Rogers, AR, and Gainesville, GA punch above their weight for retail. Local population influx and consumer-facing job gains support demand. These patterns align with migration trends increasingly reshaping CRE demand across US markets. For multifamily, Huntsville, Ocala, and Lakeland-Winter Haven benefit from sustained population and migration inflows. Myrtle Beach and Spartanburg, SC, also climb the rankings.
Notably, weaker Midwest averages (Illinois, Iowa, Wisconsin metros score in the high 80s–low 90s) are offset by surprise breakouts in Springfield, MO and Bloomington, IN, both of which jumped above the 100 average after long slumps. Grand Forks, ND, Lake Charles, LA, and Lexington Park, MD also posted 20+ point gains in just two years, outpacing nearly every large metro.
Why It Matters
NAR’s demand index marks a methodological shift in how CRE professionals can assess market potential, focusing upstream on economic drivers rather than trailing indicators like occupancy or rent growth. Where vacancy and transaction data can lag local momentum by months or years, tracking metro-level job growth and migration patterns offers a forward-looking gauge of where demand will materialize next. Per NAR’s Q2 2026 release, the weighting of industrial and multifamily reflects their 50%+ share in overall CRE activity since 2022, underlining how shelter and logistics have become the largest growth engines post-pandemic.
This context is especially relevant as national CRE sales volume remains below pre-pandemic highs, forcing investors and developers to hunt for localized pockets of outperformance rather than rely on broad-brush regional playbooks. The index’s granular take—distinguishing, for example, between Raleigh’s continued acceleration, Austin’s soft landing, and Miami’s slide below average—lets practitioners match capital to regional fundamentals and sectoral strengths.
The broader implication: the period of one-size-fits-all Sun Belt dominance is ending. CRE demand is turning more idiosyncratic, rewarding local market analysis and diversified portfolios built around genuine economic momentum. For brokers, owners, and lenders, NAR’s index offers a new lens for identifying pre-leasing opportunities and downside risks—well before conventional leasing stats catch up.
What’s Next
NAR will update its Commercial Real Estate Demand Index quarterly, with the next release expected in November 2026. As capital continues to chase the healthiest local economies rather than national trendlines, market participants should expect more volatility in rankings—and opportunities in unexpected metros. Smaller cities with unique economic drivers may see outsized gains, while gateway markets could finally find a bottom. CRE’s next cycle will depend less on national narratives and more on granular employment and migration trends—metrics the new NAR index is designed to spotlight.