






- Industrial construction volume nationwide dropped 12% year-over-year in H1 2026, per CPE, but the top 10 markets delivered nearly 60M SF.
- Dallas-Fort Worth led with 14.9M SF, while non-coastal hubs such as Louisville and Reno posted some of the biggest delivery gains.
- Future pipelines vary widely—some markets are pausing after record years, while others have growing under-construction totals signaling more supply ahead.
Inland Metros Drive H1 2026 Supply
US industrial construction finished H1 2026 in a lower gear, with completed projects totaling 135.5M SF nationwide—a 12% decline versus the same period in 2025, and a nearly 47% drop compared to the first half of 2024, according to CPE. Despite the overall slowdown, development activity became more concentrated, as the top 10 metros accounted for roughly 44% of all US deliveries in the period.
This shift has favored several inland logistics hubs over traditional coastal entry points. Markets like Dallas-Fort Worth, Louisville, and Reno not only cracked the top 10 but also posted major year-over-year gains in new supply. Their combined deliveries rose 20% compared to H1 2025, a bright spot for regions leveraging core distribution advantages as national demand moderates.
Get Smarter about what matters in CRE
Stay ahead of trends in commercial real estate with CRE Daily – the free newsletter delivering everything you need to start your day in just 5-minutes
The Details
Dallas-Fort Worth led all markets, delivering 14.9M SF across 58 buildings, up 28% year-over-year and representing 11% of total US industrial completions. The area also posted the largest pipeline, with 33.7M SF under construction as of June. Houston followed with 12.9M SF in 80 projects—a 50% increase from H1 2025—though its new starts suggested a slowdown is coming. Chicago rounded out the top three with 6.7M SF delivered, an 89% gain, backed by a robust expansion pipeline but moderating starts.
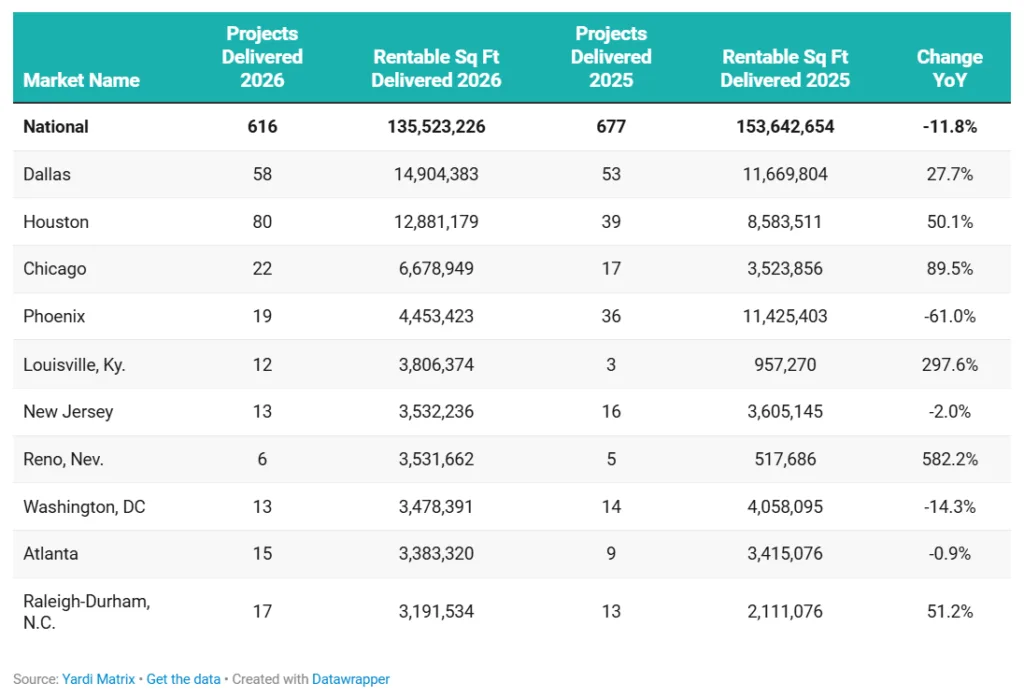
Other notable performers: Phoenix held steady with a sizable pipeline (30.8M SF under way) despite a 61% drop in deliveries, and Louisville’s 3.8M SF marked a nearly fourfold jump. Reno saw nearly six times its 2025 completions, with Tesla’s Semi manufacturing facility driving half the metro’s activity. Atlanta, DC, and Raleigh-Durham all delivered in the 3–3.5M SF range, with Raleigh posting the third-highest inventory growth rate at 2%.
Distribution Patterns Shift From Past Cycles
Unlike the last cycle, inland locations with strong transportation networks have grabbed a disproportionate share of new deliveries in 2026. Six of the 10 leading markets achieved year-over-year growth, per CPE, bucking the national trend. Louisville’s momentum also extends to investment activity, including W.P. Carey’s $102M acquisition of a major industrial property in the market. Emerging hubs like Louisville, Reno, and Raleigh-Durham posted some of the steepest delivery gains.
Construction pipelines also diverged significantly by market. Dallas-Fort Worth and Phoenix each have more than 30M SF under construction, while others like Louisville and Reno show much thinner pipelines after unprecedented bursts in 2026. Atlanta and DC have increased starts, hinting at more robust delivery volumes to come.
Why It Matters
The reordering of US industrial construction has clear implications for investors, developers, and supply chain planners. Dallas-Fort Worth’s dominant 14.9M SF delivered underscores its continued appeal for bulk distribution and last-mile facilities. With 33.7M SF still in the works, the Metroplex is likely to maintain its lead—even as national deliveries slow.
Rising stars like Louisville (3.8M SF, up nearly 4x) and Reno (3.5M SF, up nearly 6x), both captured sharp demand growth but could see output drop off if their pipelines aren’t refilled, as each reported sharply lower starts. Meanwhile, legacy logistics powerhouses like New Jersey and Los Angeles were largely absent or down, reflecting higher land and operating costs, tightening availabilities, and shifting tenant location preferences.
Supply imbalances remain a risk. Certain markets are still unloading record speculative inventory from the 2021–23 boom, especially in Phoenix, where starts doubled to 15.2M SF despite a sharp plunge in completions. Nationally, JLL and CBRE both flagged heightened caution on project launches, citing increased capital costs and moderating tenant demand as forces likely to suppress further activity in 2027.
What’s Next
The rest of 2026 and 2027 will likely be defined by uneven delivery volume as inland markets with strong pipelines bring new product to market, while others enter a pause. With national pre-leasing rates tracking below pre-pandemic norms and capital sources more selective—particularly for non-core locations—developers may hesitate to break ground on large new projects until absorption trends and rental growth stabilize.
Markets like Dallas-Fort Worth, Phoenix, and Atlanta are poised to deliver the bulk of remaining US industrial space in the next 12 months, with current under-construction totals suggesting robust but regionally targeted supply. Watch for further shakeups in industrial market leadership if development capital continues to chase lower-cost growth corridors away from the coasts.