




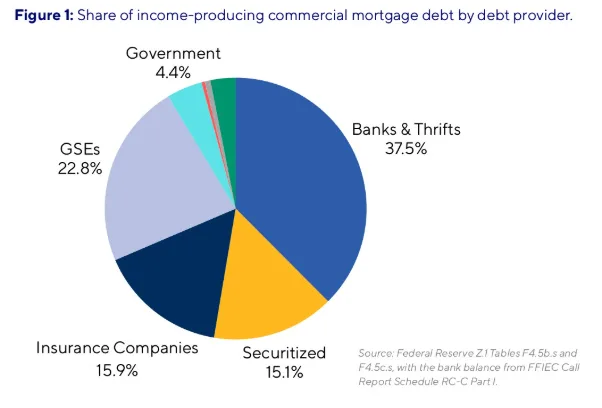
- Income-producing CRE debt stands at $5.12T through Q2 2026, with banks holding $1.92T (37.5%), GSEs 22.8%, insurers 15.9% and securitized lenders 15.1%.
- Banks have $239.7B of loans due in 2026 (12.5% of balances) and securitized lenders $113.1B (14.7%), while GSE and insurer books skew toward longer maturities.
- Stated maturities likely overstate what must refinance in any year because many near-term loans have extension options or were already modified, Trepp says.
Income-producing commercial real estate debt stands at $5.12 trillion through Q2 2026, according to Trepp’s CRE Debt Universe report. The mix of lenders stayed stable.
Banks and government-sponsored enterprises (GSEs) added the most dollars in the quarter.
Get Smarter about what matters in CRE
Stay ahead of trends in commercial real estate with CRE Daily – the free newsletter delivering everything you need to start your day in just 5-minutes
Banks Hold the Largest Share
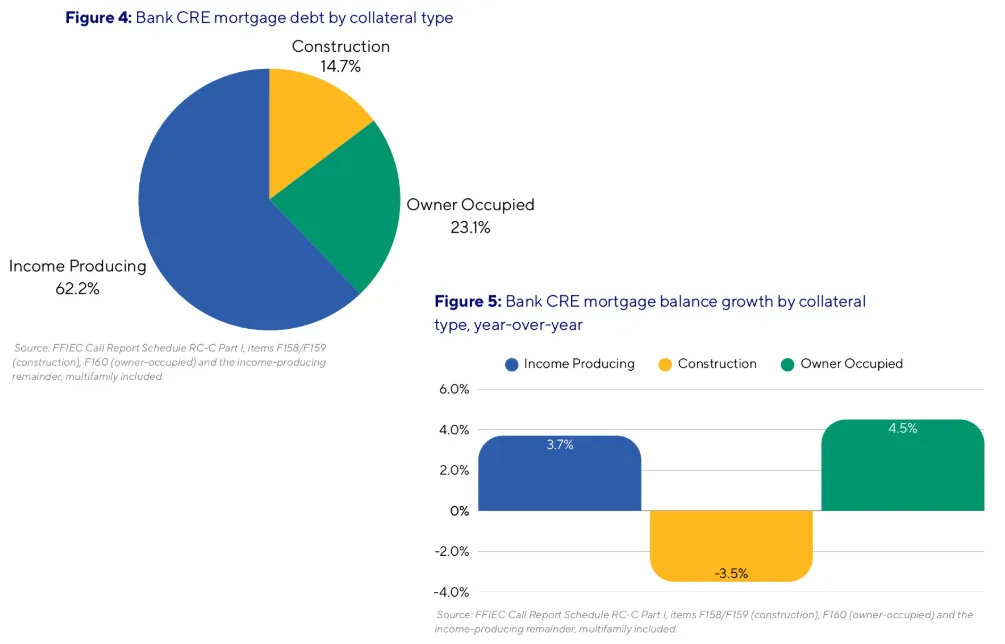
Banks hold $1.92T in income-producing loans, or 37.5% of the total. They also carry $1.17T in construction ($454.2B) and owner-occupied ($712.0B) loans. Together, these holdings bring their broader CRE book to $3.09T.
Meanwhile, GSEs hold $1.17T (22.8%), insurance companies $815.1B (15.9%) and securitized lenders, including CMBS, $771.1B (15.1%). Government and other holders account for the remaining 4.4%.
Trepp describes the composition as stable. In other words, recent growth has not changed who funds CRE. When bank construction and owner-occupied loans are included, the broader CRE debt universe reaches about $6.3T.
GSEs and Insurers Grow Fastest
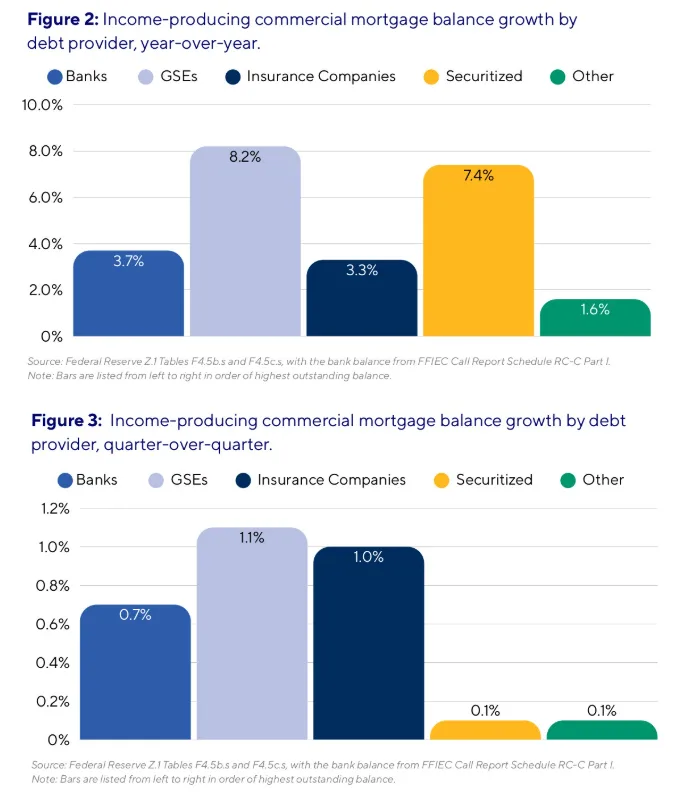
On a year-over-year basis, GSEs led with 8.2% growth. Securitized lenders followed at 7.4%, while banks grew 3.7%. Insurers posted 3.3% growth.
The quarterly picture was similar. GSE balances rose 1.1% and insurer balances gained 1.0%, ahead of banks at 0.7%.
By contrast, securitized balances increased just 0.1% after a strong prior quarter. Trepp says this pause is worth watching.
Near-Term Maturities Sit With Banks and CMBS
Using lender-specific maturity patterns, Trepp estimates that banks have $239.7B in income-producing loans due in 2026. That represents about 12.5% of their balances.
Securitized lenders face another $113.1B in maturities, or 14.7% of their balances.
The 2027 figures are even larger. Banks face $353.5B in maturities, while securitized lenders face $180.3B. Meanwhile, CRE Daily has tracked the pressure building in CMBS hard maturities.
GSE and insurer portfolios have longer timelines. Together, these two lender types account for $952.8B of the $1.88T maturing in 2031 or later.
Stated Maturities Overstate the Wall
Trepp cautions that many near-term bank and securitized loans include borrower extension options. Others have already been modified. As a result, the stated schedule likely overstates how much debt must refinance or resolve in any single year.
The firm says this turns refinancing risk into a process that depends on each loan’s circumstances. Loans with stable cash flow or sponsor support are more likely to secure extensions.
However, weaker assets face greater refinancing pressure or potential liquidation.
Banks Pull Back on Construction
Bank construction balances fell 3.5% year over year and remained flat in Q2. By comparison, owner-occupied balances rose 4.5%, while income-producing balances grew 3.7%.
Trepp links the construction pullback to elevated building costs and cautious risk appetite. In addition, construction loans typically have short terms.
About 12.7% of these loans mature in 2026, and 68.9% mature by the end of 2028.
What Is Driving Each Lender
Trepp says rate cuts from late 2025 continue to support bank balance growth. As a result, bank lending has maintained a steady pace.
Meanwhile, GSE growth reflects their role as the primary liquidity provider to multifamily. Insurers also remain a stable credit source because their long-term liabilities limit their sensitivity to short-term funding costs. With base rates still supporting attractive yields, they continue to play an important role.
Securitized lending remains up 7.4% year over year. However, the latest quarterly stall deserves attention.
Looking ahead, higher-for-longer rate expectations, geopolitical volatility and private-credit uncertainty could weigh on lender appetite. On the other hand, potential relief on risk-weighted assets could support bank balance sheets.
Why It Matters
Lending capacity remains in place, but banks and CMBS face much of the near-term resolution burden. Trepp says renewed inflation concerns and oil-price volatility have made the outlook less certain.
Consequently, borrowers may rely more heavily on extensions to manage upcoming maturities.
This fits a trend CRE Daily has covered, as bridge-to-bridge loans push out the reckoning while long-term rates climb.
What’s Next
Trepp says rising long-term rates during Q3 add uncertainty to refinancing activity and lending momentum. Meanwhile, geopolitical tensions, private-credit stress and potential bank capital relief remain key factors that could shift lender appetite.