






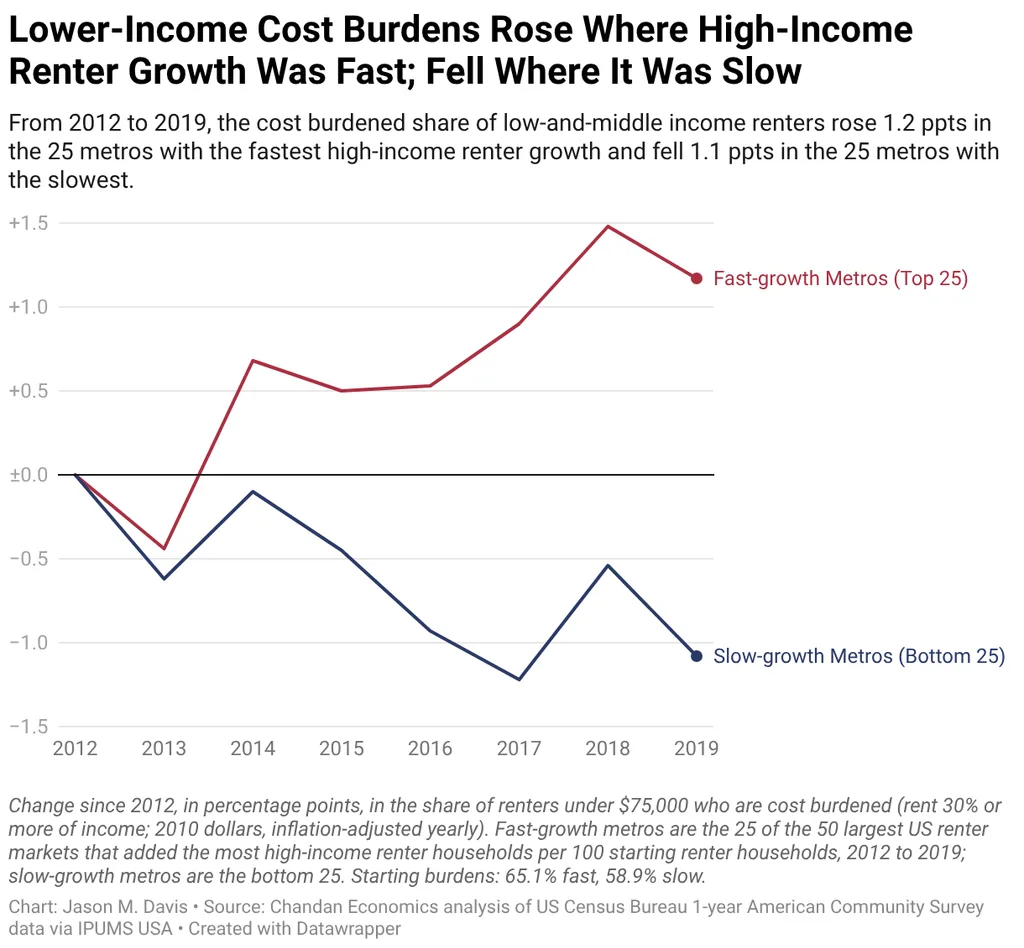
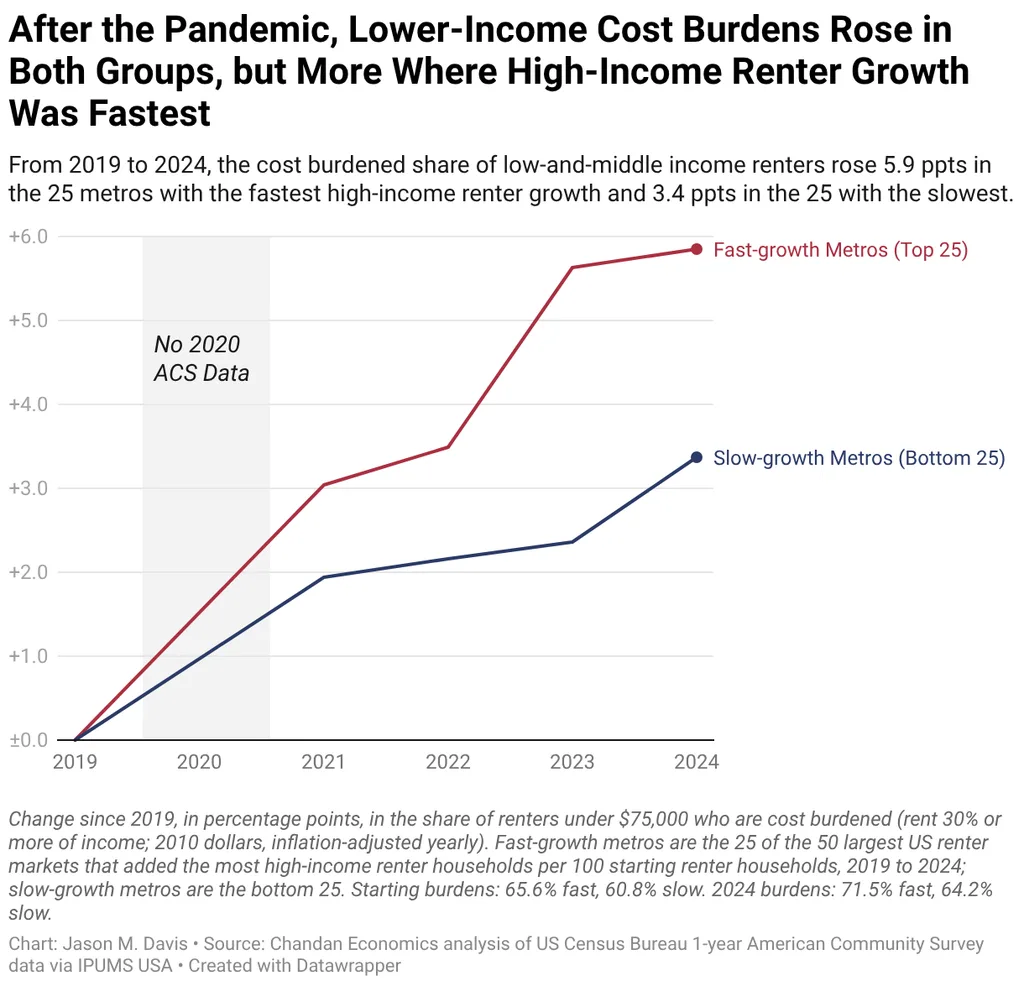
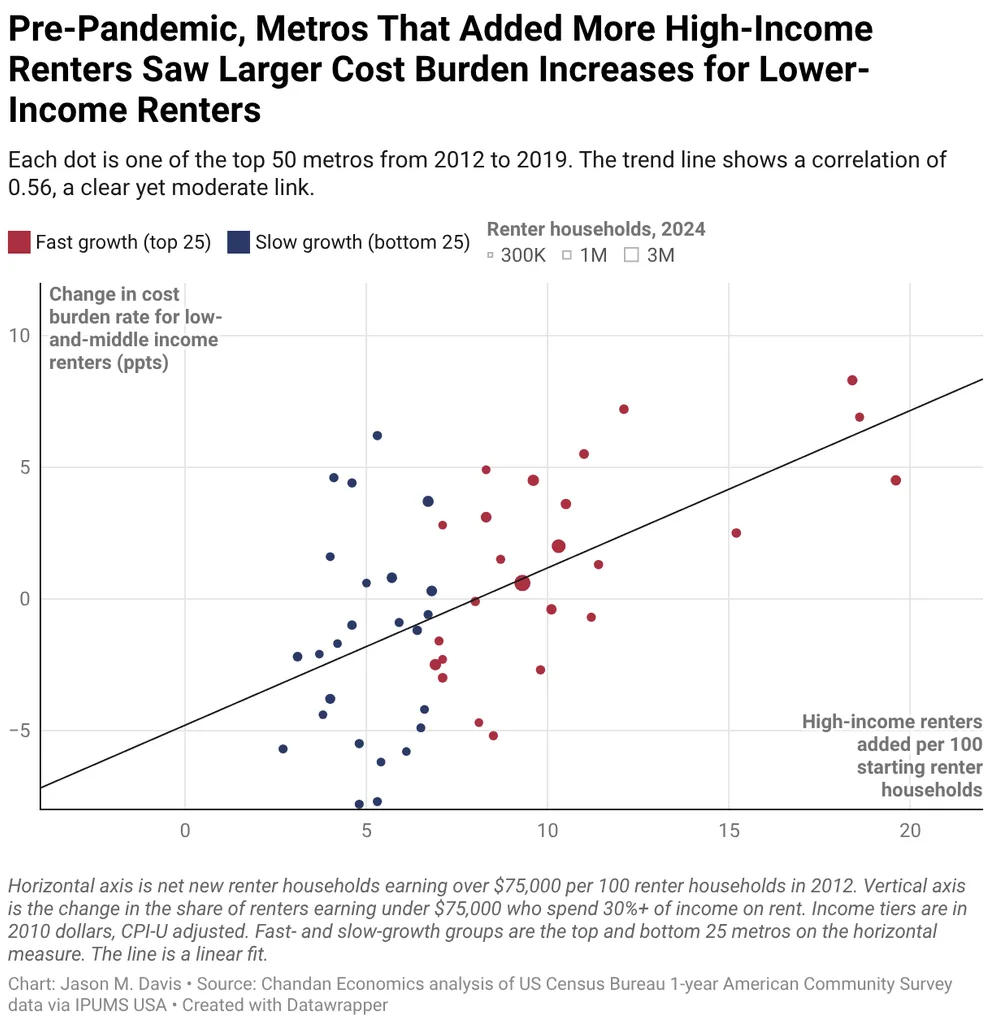
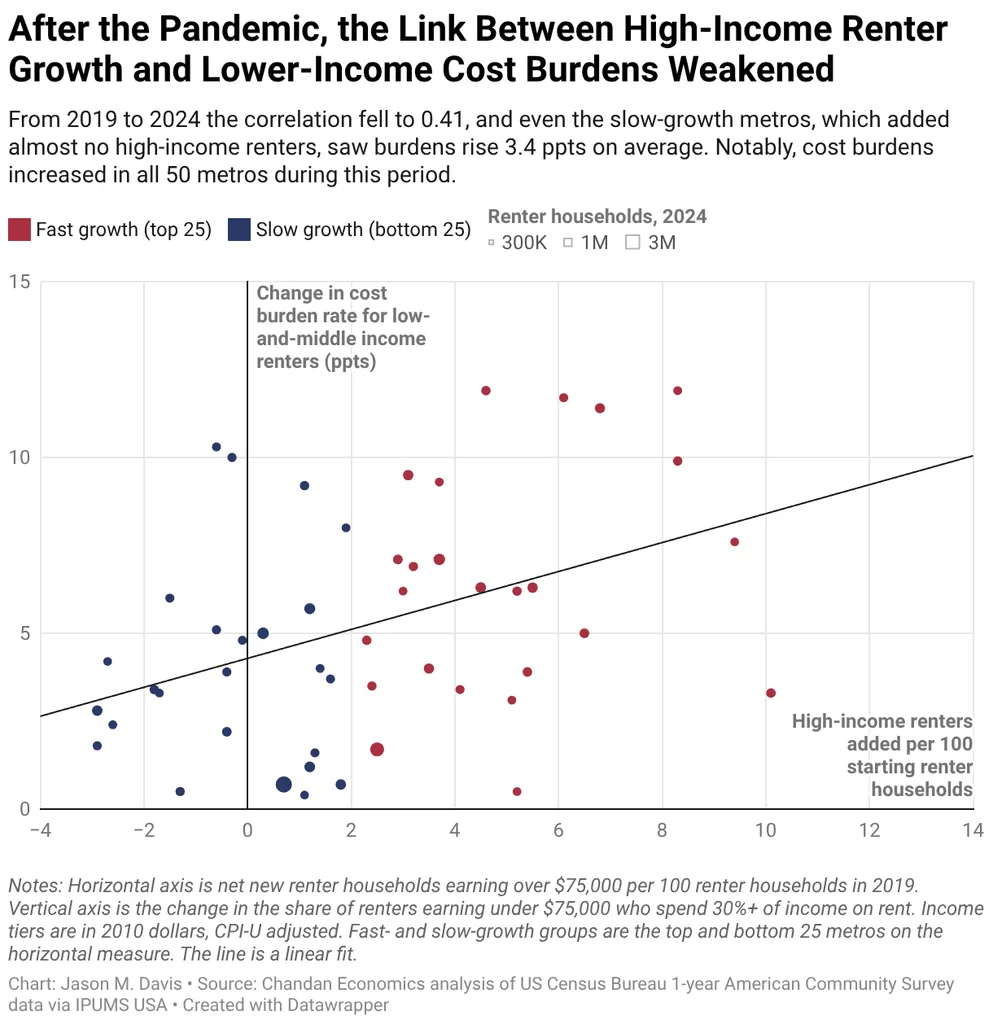
- In a Chandan Economics test of the top 50 metros, low- and middle-income renter cost burdens rose more in the 25 fastest-growing high-income metros, with gaps of 2.3 points pre-pandemic and 2.5 after.
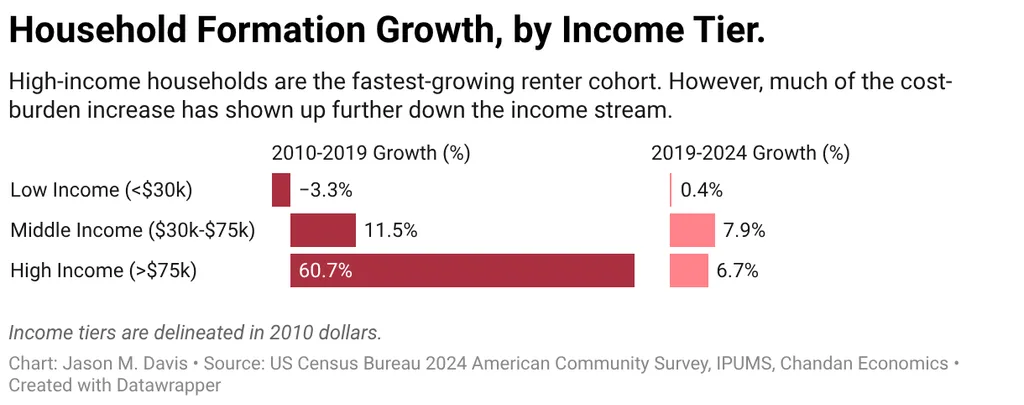
- High-income households were the fastest-growing renter cohort after the financial crisis, up 60.7% from 2010 to 2019, versus 11.5% for middle-income renters and a 3.3% decline for low-income renters.
- The link is an association, not proof of causality, but burdens kept rising after high-income growth faded, suggesting affordability pressure persists once it arrives in a market.
High-income renter demand may be pushing renter cost burdens onto lower earners. In a metro-level analysis of the 50 biggest renter markets, Chandan Economics found that lower-income households saw sharper increases wherever affluent renter growth ran hottest.
The firm calls it cost-burden filtering. Comparing fast- and slow-growth metros, the gap was 2.3 percentage points for 2012 to 2019 and 2.5 points for 2019 to 2024.
Get Smarter about what matters in CRE
Stay ahead of trends in commercial real estate with CRE Daily – the free newsletter delivering everything you need to start your day in just 5-minutes
Who Drove Renter Growth
After the financial crisis, households earning more than $75,000 in 2010 dollars became the fastest-growing renter group, expanding 60.7% through 2019. Middle earners grew 11.5%, and low-income renter households shrank 3.3%.
Burdens went the opposite direction. In both periods, cost pressure built for lower and middle earners but stayed tepid for high earners, who often rent by choice.
How They Tested It
Chandan ranked the metros by growth in high-income renters and compared the top half with the bottom half. If filtering is real, lower earners in the fast group should be hit harder.
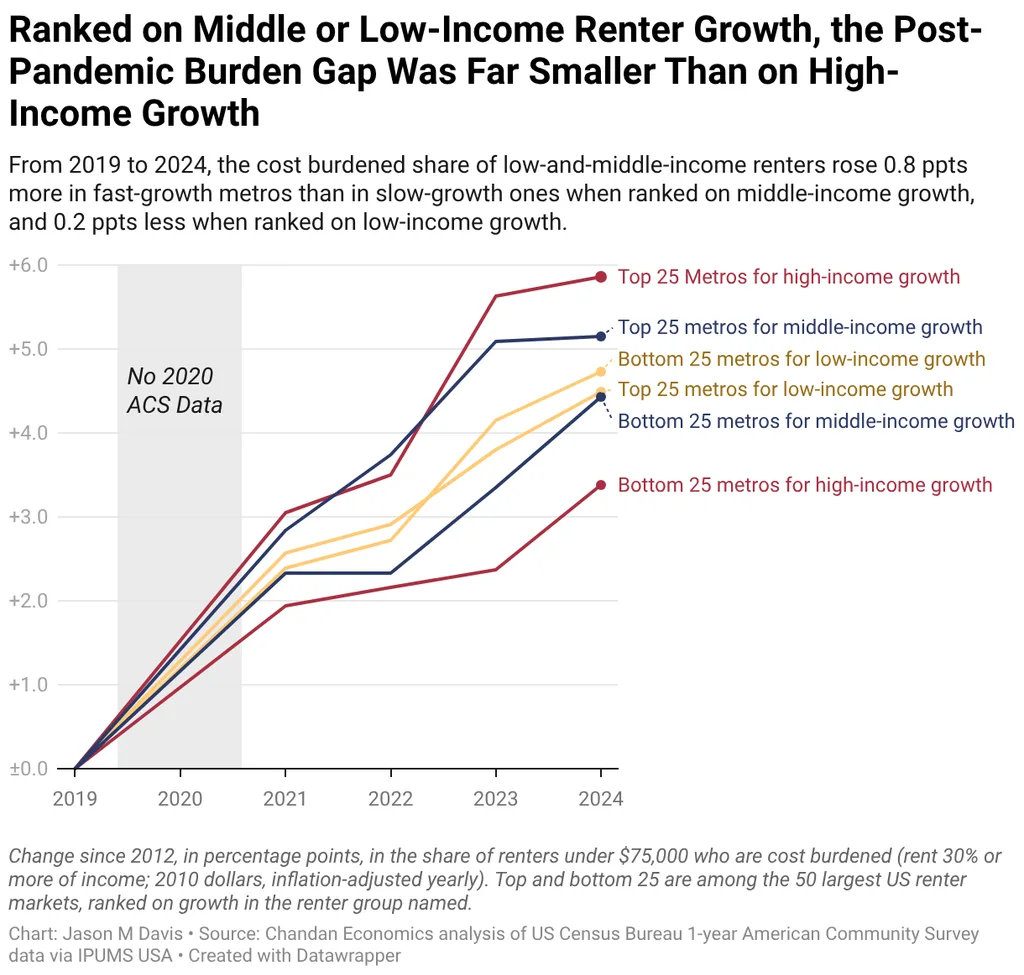
Since 2019, the fast group’s burden climbed 5.9 points versus 3.4 for the slow group.
High-Income Growth Stands Apart
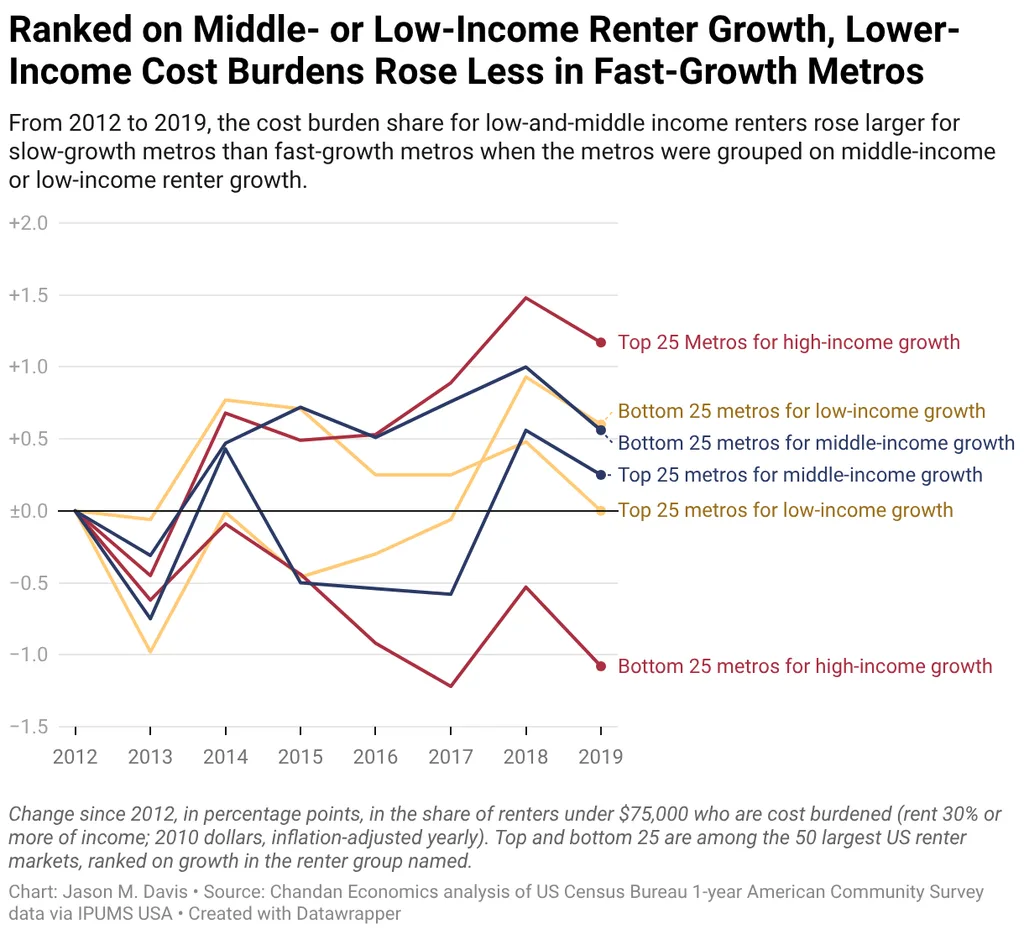
Ranking metros by middle- or low-income renter growth gave much smaller, inconsistent gaps: 0.8 points and 0.2 points, respectively, after the pandemic.
Pre-pandemic, fast-growth metros gained 10.4 affluent renters for every 100 renter households, against 5.2 in the slow group. More recently, it was 4.4 versus 0.1.
Burdens Followed the Demand
Seven metros moved into the fast group after the pandemic, among them Phoenix, Tampa and San Antonio. Seven others, including New York, San Francisco and Chicago, dropped out.
In the newcomers, burden growth since 2019 averaged 7.6 points, compared with about 5 for the departures and for the metros that held steady. In other words, pressure didn’t leave when high-income growth cooled.
Zoom Out
Investors have been chasing affluent tenants. Our brief on the K-shaped economy covered how oil prices and widening income splits are pushing capital toward property types that serve higher earners, with senior housing topping MetLife’s 2026 scorecard.
Chandan’s caveats matter: the finding is an association across group averages, and New York alone accounts for about a quarter of the slow-growth bucket. A test on the top 100 metros showed the same pattern.
Filtering Meets Demand
The classic idea of filtering is about supply: as buildings age, they lose value and move down the income ladder. Stuart Rosenthal’s work on 1985 to 2011 data estimated a 2.5% annual filtering rate for rental housing.
Chandan’s test looks at the demand side. It cites Harvard research arguing that when affluent renters take up new buildings, fewer older apartments filter down, and a 2026 review finding that apartments renting under $1,400 dropped by 9.3 million from 2014 to 2024.
Why It Matters
Income gaps shape what renters can access. A Zillow analysis we covered found a $100K income unlocks 77% of rental listings, versus 31% for a typical renter earning $58,000.
Chandan stresses that high earners aren’t to blame, since supply is tight for them too. Between 2006 and 2016, Harvard found, their renter households outgrew the stock of $2,000-plus units by roughly 1.25 million.
What’s Next
Watch the Sun Belt metros that joined the fast-growth group, including Phoenix, Tampa and San Antonio.