






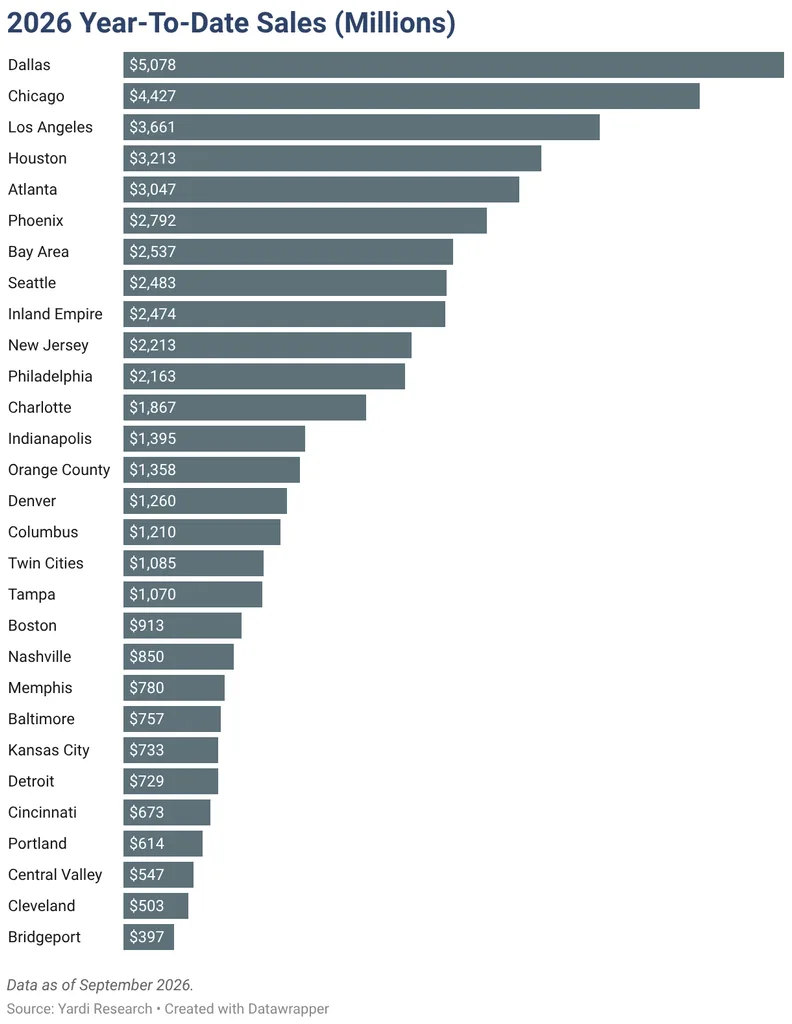
- Industrial buyers traded roughly $74.4 billion of assets through September at $140 per SF, with Dallas leading at $5 billion and Chicago second at $4.4 billion.
- Bay Area sales rose 269% year over year to $2.5 billion, while Indianapolis volume grew 198% and Philadelphia’s jumped 154%, per Yardi Matrix data in CommercialCafe’s report.
- Warehouse employment fell 1.2% year over year to 1.83 million, 5.5% below its March 2022 peak, as operators lean on automation and need less labor per SF.
Chicago has logged $4.4 billion in industrial sales through September, second only to Dallas’ $5 billion, according to CommercialCafe’s October industrial report.
The report draws on Yardi Matrix data. Roughly $74.4 billion of industrial assets have traded nationally this year at an average $140 per SF.
Get Smarter about what matters in CRE
Stay ahead of trends in commercial real estate with CRE Daily – the free newsletter delivering everything you need to start your day in just 5-minutes
Chicago Closes the Gap
Chicago is the surprise. It hasn’t ranked higher than fifth in investment volume over the past four years, yet this year’s total is up 133% from a year ago.
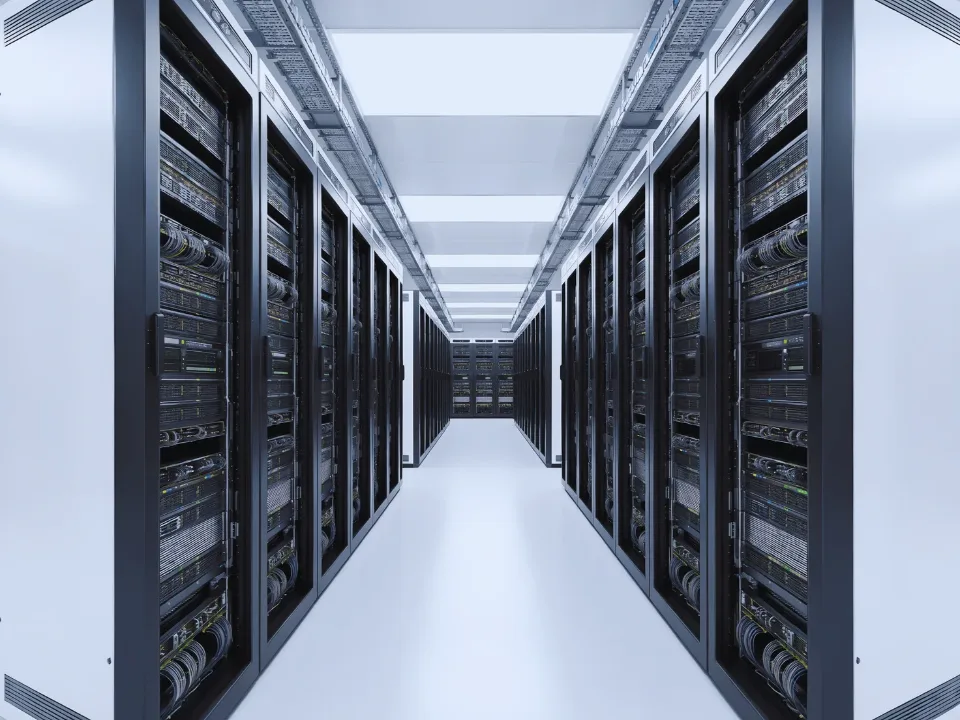
One deal skews the math. GI Partners’ $750 million Elk Grove Village data center purchase made up 17% of volume and lifted the average to $123 per SF, up 34%. Leave data centers out and prices still rose 10.3% to $101 per SF.
West Coast Rebounds
Bay Area sales reached $2.5 billion, up 40% from August and 269% from $687 million a year earlier. Vacancy there climbed to 9.7%, matching the national rate.
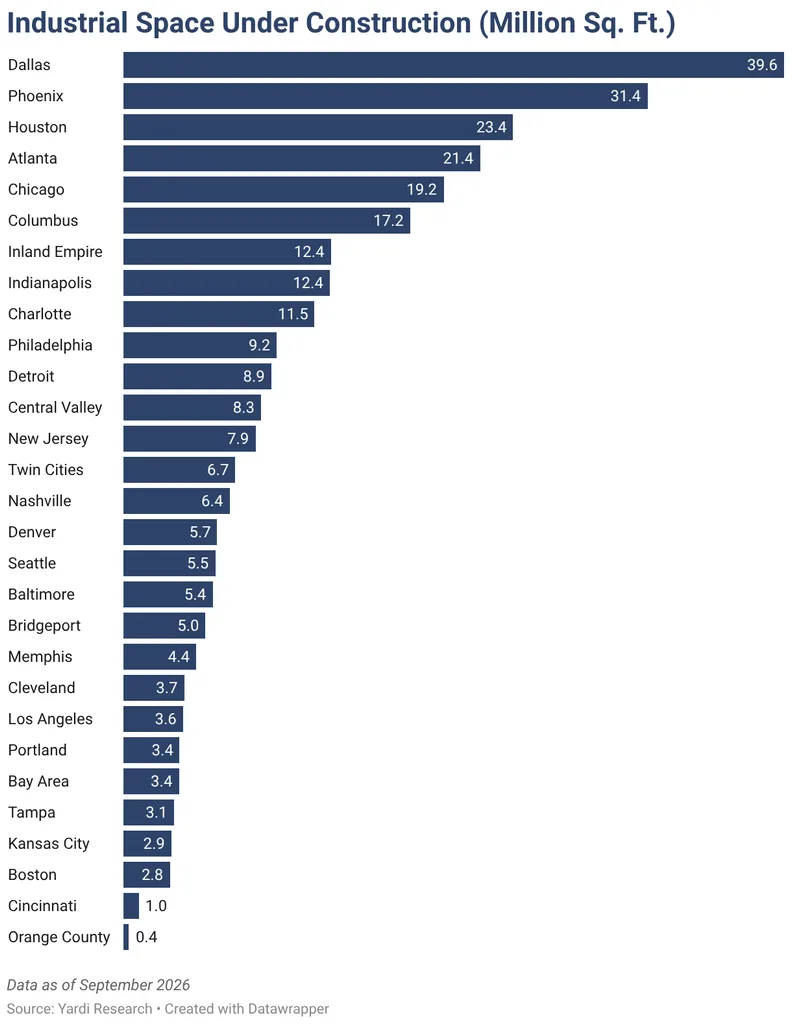
Inland Empire values rose 10% in the month to $178 per SF, and its pipeline is 12.4 million SF, up 233% year over year. Phoenix still leads the region with 31 million SF under construction.
Heartland and East Coast Surges
Indianapolis sales volume rose 198% to about $1.4 billion, and its pipeline reached 12.3 million SF after a 29% monthly jump. Philadelphia posted $2.16 billion, up 154%, with a pipeline of 9.2 million SF.
Charlotte’s year-to-date volume reached $1.86 billion, up 70% year over year. Nashville hit $850 million.
Rents and Premiums
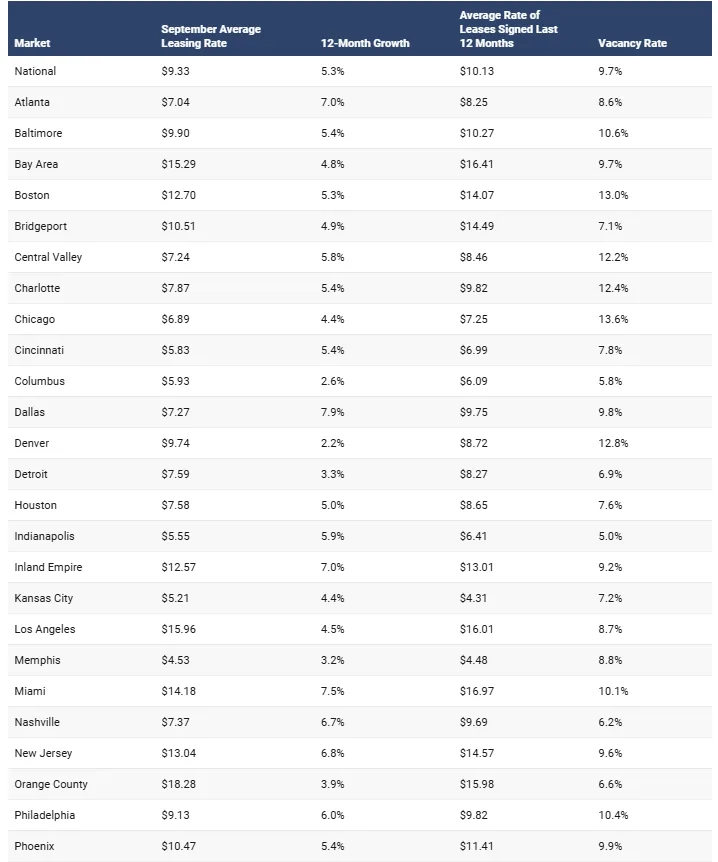
National in-place rents averaged $9.33 per SF in September, up 5.3% from a year earlier, with Dallas at 7.9% and Miami at 7.5%. Vacancy rose to 9.7%.
The gap between new-lease and in-place rents has narrowed to $0.80 nationally. It is still $3.98 in Bridgeport, Conn., $2.79 in Miami and $2.48 in Dallas.
Supply Keeps Building
The national pipeline holds about 463.3 million SF, up from 357.4 million SF in January. Owner-occupied projects account for 27% of 2026 starts, or 76.1 million SF through three quarters.
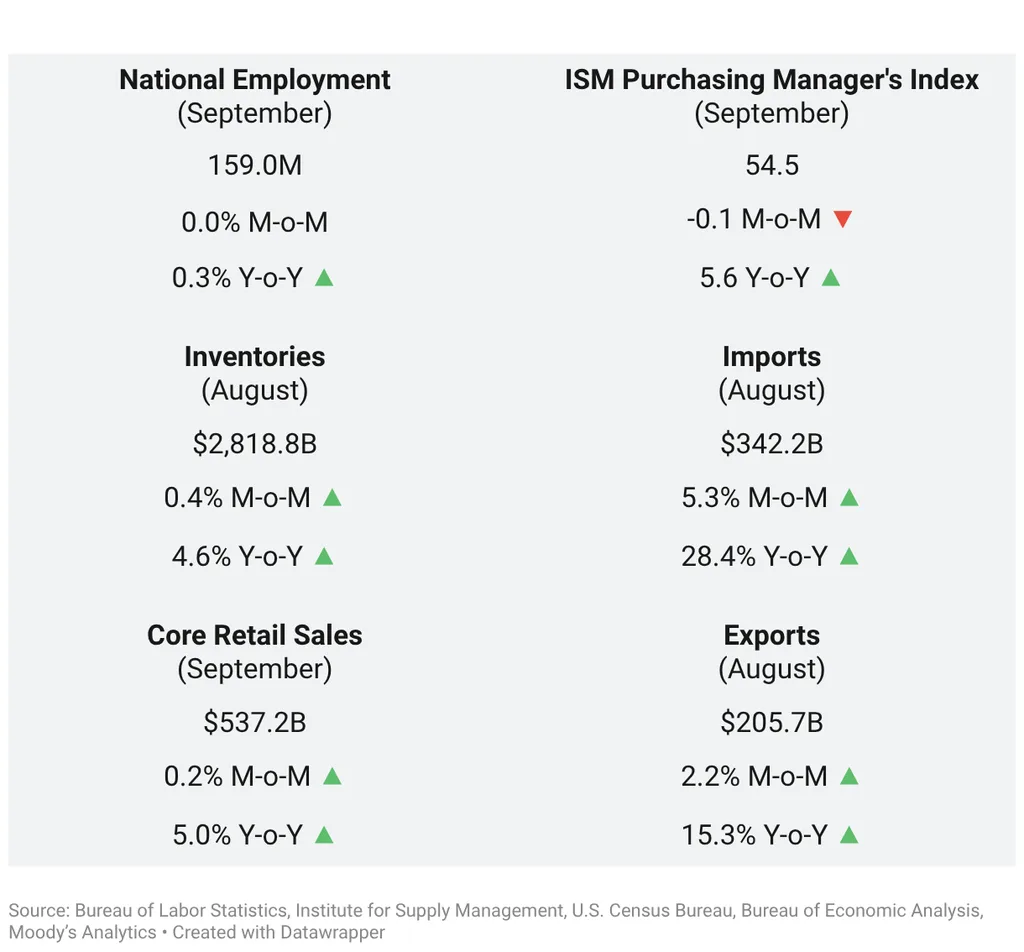
Costs are climbing too. September input prices for new non-residential construction rose 11.9% year over year, per the Bureau of Labor Statistics, and the report says tariffs have lifted steel 28%, aluminum 25% and copper and brass 30%.
Sun Belt and Midwest Pipelines
Atlanta has 21.3 million SF underway, up 25% in September and 97% year over year, with vacancy at 8.6%, below the national rate. Miami rents reached $14.18 per SF after a 7.5% annual gain.
Columbus rents rose about 3% in the month to $5.93 per SF. Vacancy rose 170 basis points year over year in St. Louis and 290 in Kansas City, while New Jersey rents climbed nearly 7% to $13.04.
Jobs Lag Space
Warehousing and storage employed 1.83 million workers in September, down 1.2% from a year ago and 5.5% below the March 2022 peak. Demand for space keeps growing while headcount does not, as operators automate.
CommercialCafe expects labor needs to keep falling as occupiers favor modern, automation-ready buildings.
Why It Matters
The takeaway: capital is spreading beyond the usual leaders. It also fits the supply story we told earlier this week, when industrial starts reached 274.4 million SF through three quarters and power access emerged as the top siting constraint.
Tenants are showing up, too. Big box leasing reached 170.6 million SF in the first half, per Colliers, the strongest stretch since 2022.
What’s Next
With the national pipeline at roughly 463.3 million SF, up from 357.4 million at the start of the year, the next reports will show whether sales volume keeps spreading across metros.