


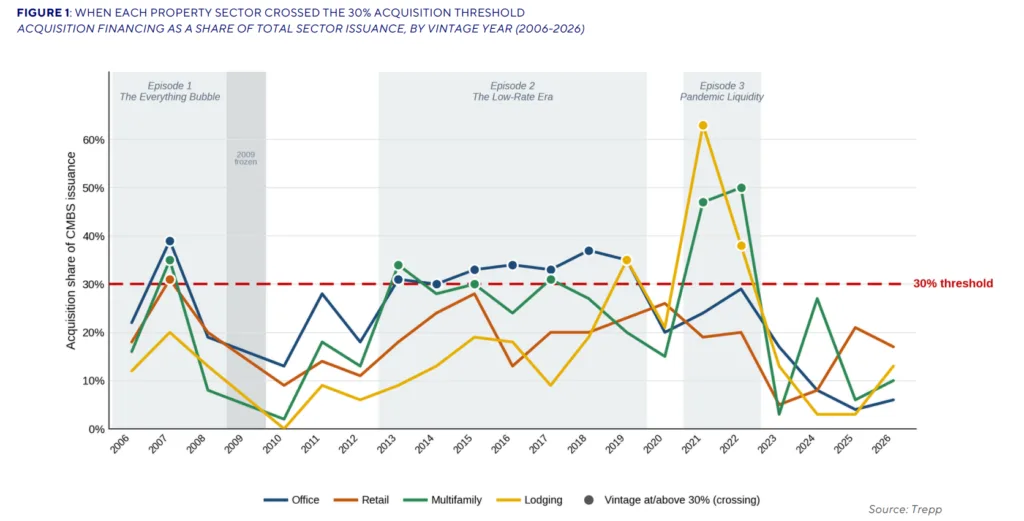
- Trepp data shows that when acquisition financing exceeds 30% of CMBS issuance, CRE markets have historically faced heightened risk.
- The 30% threshold has preceded every major CRE correction since 2007 and is flashing again as 2021–2022 vintage loans become distressed.
- While today’s market is dominated by refinancing, the next run-up in acquisition share could be an early warning sign for investors.
The Long Shadow of the 30% Acquisition Rule
There’s a recurring signal in commercial mortgage-backed securities (CMBS) that has reliably warned of trouble ahead in US commercial real estate. According to Trepp’s June 2026 research, each time acquisition financing climbs to roughly 30% of total CMBS sector issuance, the market tips into a high-risk zone. That threshold has flashed before every CRE correction over the past 20 years—from the ‘07 bubble through the 2021 pandemic-fueled buying frenzy.
The signal’s logic is simple: as the share of new CMBS loans funding acquisitions rises, buyers are less focused on current income and more on momentum, betting rents and values will keep rising. Trepp data from 2005–2026 shows this pattern precedes surges in delinquencies, special servicing, and lasting pain for peak-vintage lenders and investors.
Get Smarter about what matters in CRE
Stay ahead of trends in commercial real estate with CRE Daily – the free newsletter delivering everything you need to start your day in just 5-minutes
When Momentum Overtakes Income
The 30% acquisition share isn’t a forecast—it’s a behavioral indicator. When more than 30% of CMBS volume is going to acquisitions (not refis), the market is crowded with buyers chasing appreciation, not fundamentals. In 2007, acquisition financing soared: office hit 39%, retail 31%, and multifamily 35%. By 2008, issuance collapsed by 95%. Similar patterns emerged during the low-rate, QE-fueled expansion from 2014-2019, with multifamily and lodging pushing past the warning zone, and again in 2021 at the pandemic’s liquidity peak—multifamily hit 47%, lodging 63%. Each run-up was followed by deteriorating performance, higher delinquencies, and a punishing credit cycle for anyone holding peak-vintage paper.
The Details
Trepp’s data shows this pattern across three major cycles. In 2007, CMBS issuance reached $228.1B as the acquisition signal flashed red. By 2009, new issuance had nearly disappeared.
Low yields during quantitative easing fueled another surge between 2014 and 2019. Acquisition shares climbed above 34% in multifamily and 35% in lodging. Those levels laid the groundwork for future distress.
The biggest spike arrived in 2021. Multifamily acquisition share reached 47% on $19.3B in originations, while lodging climbed to 63%.
By early 2026, Trepp tracked 252 delinquent or specially serviced multifamily and office loans from the 2020–2022 vintages. Those loans totaled nearly $4.8B. They affected 148 properties and more than 50 loans across New York, Houston, Chicago, and Philadelphia.
Pandemic-Era Loans Show Cracks
The pandemic boom continues to weigh on the market. The 10-year Treasury climbed from 1.3% during the 2021 buying surge to nearly 5% in October 2023. As rates rose, many properties bought on aggressive assumptions struggled to perform. That pressure has intensified as CMBS delinquency rates continue climbing across troubled property sectors.
Examples include 230 Park Avenue in New York, with sub-0.65x DSCR and 55% occupancy. Bellevue West in Nashville has also seen NOI fall 28% since acquisition.
Office and multifamily acquisition shares have now dropped to 4–6% in 2026. Refinancings account for 79–84% of issuance. However, the market still works through peak-era assets. Many owners rely on extensions, fresh equity, or discounted payoffs to manage higher borrowing costs.
Why It Matters
A 30% acquisition share signals market risk, not exact timing. The metric helps identify when investor optimism drives pricing more than property income.
Every major CRE downturn over the past two decades crossed this threshold before conditions deteriorated. Some assets remain unresolved today. Chicago’s 2 North LaSalle, for example, now carries a loan-to-value ratio of 184.8%, according to Trepp.
During the pandemic, the Fed bought $120B in bonds each month, including $80B in Treasuries. That policy lowered borrowing costs and encouraged buyers to pay for future growth. Much of that growth never arrived after 2022.
Today, many loans originated at 2021 values sit underwater as the 10-year Treasury remains near 4.4–4.5%. Lenders now favor restructurings, extensions, and modifications over foreclosure whenever possible.
As a result, refinancings dominate new originations. Acquisition lending remains muted while investors wait for cap rates or Treasury yields to stabilize. The next move in the 10-year Treasury could shape the market’s next cycle.
What’s Next
Complacency now poses the biggest risk. Refinancing dominates CMBS issuance, and acquisition share remains well below the warning level. As a result, the market has shifted from chasing peak pricing to managing legacy distress.
History suggests the pattern will return. When cheap debt comes back and acquisition share approaches 30%, speculation usually follows.
Investors who track this metric can spot changing conditions early. Until then, expect lenders and borrowers to keep restructuring pandemic-era loans, one property at a time.