






- CommercialCafe’s October data show U.S. office vacancy at 17.2%, down 140 basis points year over year, with listing rates averaging $33.30 per square foot, up 1.5%.
- Flight to quality is widening the gap: Class A asking rents rose 2.5% over the year while Class B rents slipped 0.3%, and Manhattan and Dallas hold the biggest pipelines.
- Year-to-date sales reached nearly $56.9 billion at $197 per square foot, yet completions don’t bottom until 2027, so outdated space will keep weighing on vacancy.
U.S. office vacancy fell to 17.2% in October, 140 basis points lower than a year earlier, according to CommercialCafe’s November national office report.
Average asking rent is $33.30 a square foot, a 1.5% gain. Yardi Research supplied the data, covering buildings of at least 25,000 square feet.
Get Smarter about what matters in CRE
Stay ahead of trends in commercial real estate with CRE Daily – the free newsletter delivering everything you need to start your day in just 5-minutes
Flight to Quality
The recovery is lopsided. Premium Class A space is in demand and makes up most new supply, so tenants are leaving older Class B buildings to fill it.
Class A asking rents rose 2.5% over the year, while Class B rents slipped 0.3%. Yardi Research’s Peter Kolaczynski said dated buildings with fewer amenities bear the brunt, while newly delivered product commands premiums.
Jobs Don’t Guarantee Occupancy
Miami shows how restrained supply pays off. Since early 2021, its office jobs are up 22.1% against inventory growth of just 5.3%, and vacancy is 11.7%.
Austin is the counterexample: jobs rose 30.4%, but 17% more space arrived, and vacancy is 23.7%.
Where Vacancy Stands
Vacancy declined annually in 17 of the biggest 25 markets, though seven remain over 20%. San Francisco is highest at 26.8%, up 60 basis points.
Manhattan is lowest at just over 10%, down 280 basis points. Phoenix improved to 17.1%, helped by a pipeline equal to only 0.2% of stock.
Capital Is Moving
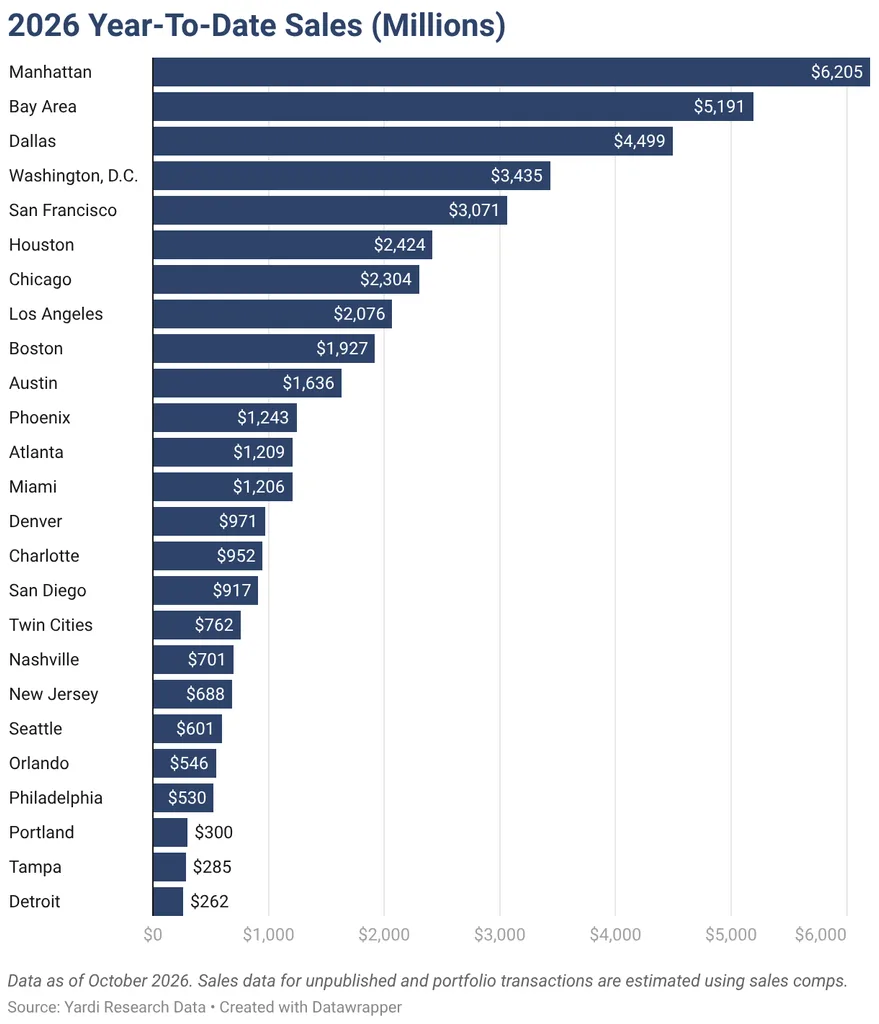
Investors closed 2,576 office deals through October for almost $56.9 billion, or $197 a square foot on average. In 13 of the biggest metros, volume topped $1 billion.
Manhattan leads with $6.2 billion. The Bay Area comes next at $5.2 billion, then Dallas at $4.5 billion, with Washington and San Francisco above $3 billion.
Nashville stands out, with prices climbing from $183 to $389 a foot and Class A leading at 163%. Shorenstein’s roughly $147 million deal for the Moore Building, about $612 a foot, ranks among the city’s costliest.
A Thin Pipeline
Construction totals 32.2 million square feet, just 0.5% of stock. Manhattan and Dallas each top 3 million, which together is over a fifth of the national pipeline.
Boston, Miami, Los Angeles and San Diego follow with between 1.35 million and 2.54 million apiece. Philadelphia, Portland and Seattle have nothing sizable underway.
Zoom Out
The quality gap shows up in availability too. Savills data we covered found only 3.6% of buildings across 14 markets offering a 50,000 SF Class A block in a top submarket, and just 0.7% in trophy buildings, per large office blocks. Dallas, one of the two big pipelines, saw office vacancy fall 360 basis points to 18.6% in September, according to Yardi Matrix.
Why It Matters
Office-using sectors added only 51,000 jobs (0.1%) year over year, versus 0.6% growth in total payrolls, and fewer than 15 of the 25 largest markets added office jobs. Health care is the bright spot, lifting demand for medical office.
What’s Next
The report sees new completions hitting a low in 2027, which should relieve some vacancy pressure. Still, it expects the glut of less desirable space to linger.