



- About 14,000 office properties have loans that recently matured or will mature by the end of 2028, totaling $289.2B.
- Eight top-25 office metros have vacancy above 20%, with $61.6B of maturing loan volume concentrated in those high-vacancy markets.
- Office CMBS delinquencies reached 12% in August, while elevated rates and lower property values continue to constrain refinancing.
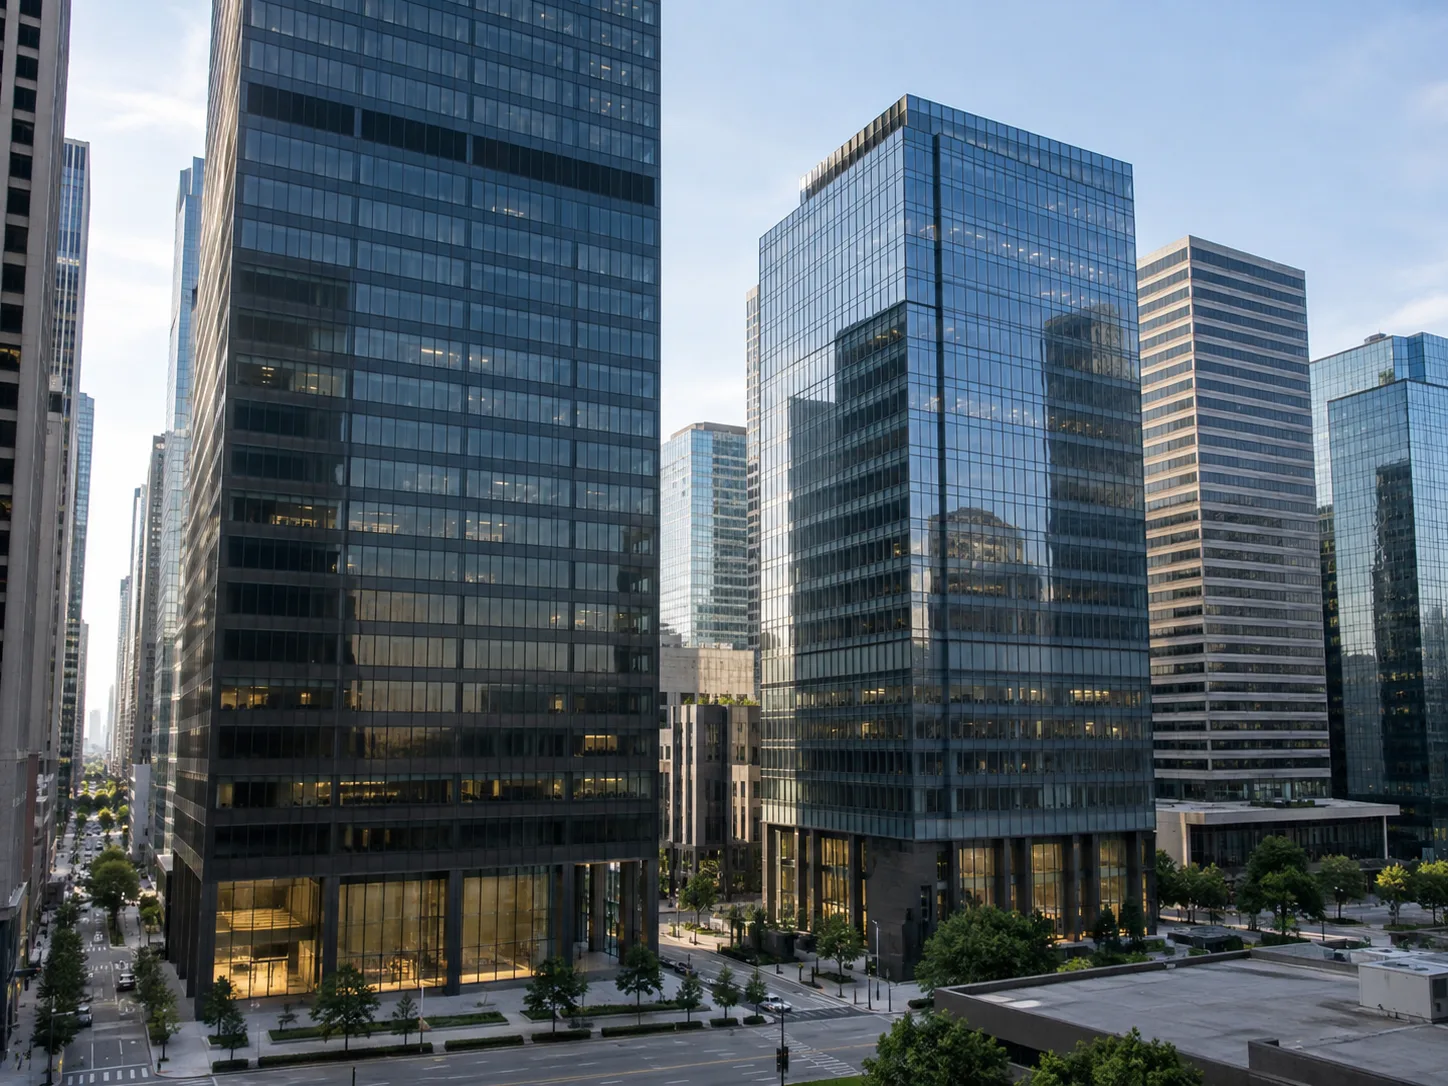
A large office maturity wave is colliding with weak demand and lower property values. Yardi Matrix’s September office market report identifies about 14,000 properties with loans that recently matured or will mature by the end of 2028. Those loans total $289.2B. That equals 33.5% of total office loan volume in the report.
Get Smarter about what matters in CRE
Stay ahead of trends in commercial real estate with CRE Daily – the free newsletter delivering everything you need to start your day in just 5-minutes
Maturity Wall Meets Weak Demand
Most of the risk comes from loans written before the office market reset. About 58.8% of the maturing volume originated before 2021. Those loans were underwritten when stronger demand was expected to support obligations through maturity. Today, national office vacancy sits at 17.8%. Office-using employment fell 0.2% year over year in August. Physical office occupancy has averaged roughly 55% over the past few years, according to Kastle’s Back to Work Barometer.
The Details
Eight of the top 25 office metros have vacancy above 20%. Those markets account for $61.6B of maturing loan volume, equal to 7.1% of all office loans in the dataset. More than half of that high-vacancy-market volume originated before 2021. The stress builds on earlier office loan maturity risk as properties face refinancing with weaker values and higher borrowing costs. The funding gap grows when loan balances remain high but new debt proceeds are constrained by lower valuations.
High-Vacancy Metros Carry More Risk
Seattle combines a 24.7% vacancy rate with $8.3B of maturing loan volume. About 70.1% of that debt originated before 2021. The Bay Area has $13.5B maturing with 22.8% vacancy. San Francisco has $12.6B with 25.9% vacancy. Portland, Houston, San Diego, Austin and Denver also have vacancy above 20% and billions of dollars of maturing loans. Yardi identifies these metros as particularly exposed because refinancing pressure meets weak leasing conditions.
Refinancing Gets Harder
Trepp reported the CMBS delinquency rate for office loans reached 12% in August. Refinancing prospects have also weakened because interest rates remain elevated. Over the past few years, nearly half of repeat-sale office properties traded below their previous sale price.
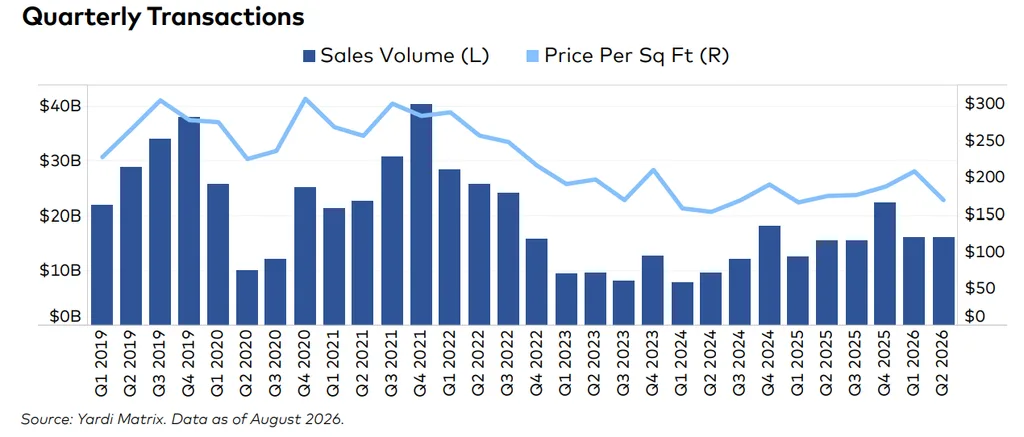
That creates a larger funding gap for borrowers that need to refinance loans originated at higher valuations. Lower collateral values can force owners to contribute more equity, accept extensions or move toward a workout. The maturity wave therefore converts operating weakness into a direct capital-structure problem.
Office Fundamentals Stay Uneven
The national average full-service listing rate was $33.20 PSF in August, down $0.38 from July but up 1.7% year over year. National vacancy fell 90 basis points from a year earlier to 17.8%. Manhattan remained the strongest major market with 10.2% vacancy after a 340-basis-point annual decline. A-class Manhattan vacancy was even lower at 9.0%, compared with 12.2% for B-class space and 14.3% for C-class. Those improvements show that the maturity problem is not distributed evenly across office markets or building quality.
Why It Matters
The maturity wall arrives while the sector is still bifurcated. Some markets and top-quality assets are recovering, but several West Coast and Sun Belt metros remain above 20% vacancy. Those weaker locations also contain billions of dollars of pre-2021 debt. National vacancy improvement therefore does not eliminate refinancing stress. Borrowers must refinance against current income and value, not the conditions that existed when the loans were originated. That keeps distress concentrated where leasing recovery and collateral values remain weakest.
What’s Next
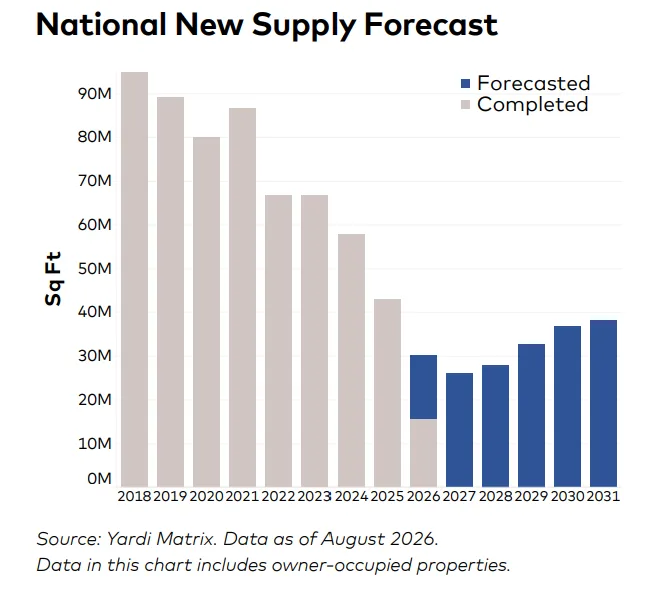
Yardi expects office property values to remain under pressure until the maturity wave subsides. New supply is also contracting, especially in central business districts. Only 2.7M SF is under construction in CBDs, equal to 0.2% of stock. That pipeline is down 61.3% year over year. Since 2024, 73% of repeat-sale CBD properties have traded at a discount. The smaller construction pipeline may reduce future supply pressure, but near-term credit risk still centers on loans reaching maturity before property income and valuations recover.