



- National advertised self storage rates fell 1.9% year over year in August to an average $16.39 PSF.
- Only four top-30 metros posted annual advertised rent growth, while 24 of 30 recorded month-over-month declines.
- Under-construction supply fell to 2.1% of existing inventory, but three-year deliveries still equal 8.8% of starting stock nationally.
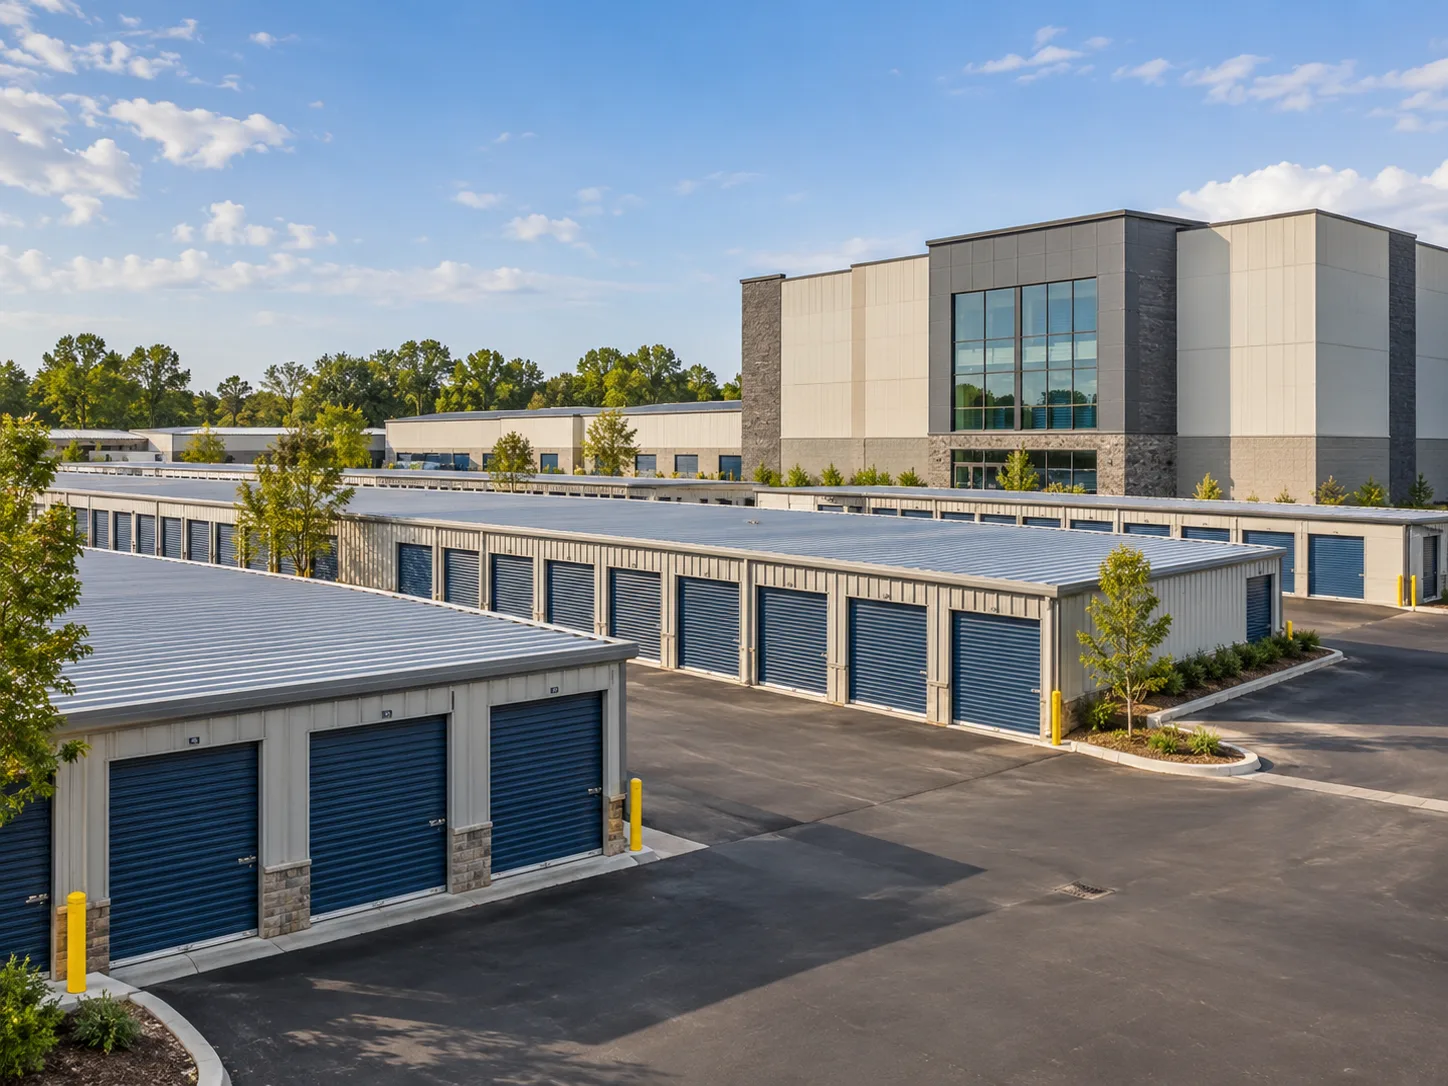
Self storage supply growth is slowing, but rent performance weakened again in August. Yardi Matrix’s September national self storage report shows advertised rates fell 1.9% year over year. That was worse than declines of 1.6% in July and 1.5% in June. The national average advertised rate slipped to $16.39 PSF as weak demand and lingering lease-up supply outweighed the smaller development pipeline.
Get Smarter about what matters in CRE
Stay ahead of trends in commercial real estate with CRE Daily – the free newsletter delivering everything you need to start your day in just 5-minutes
Rate Declines Broaden
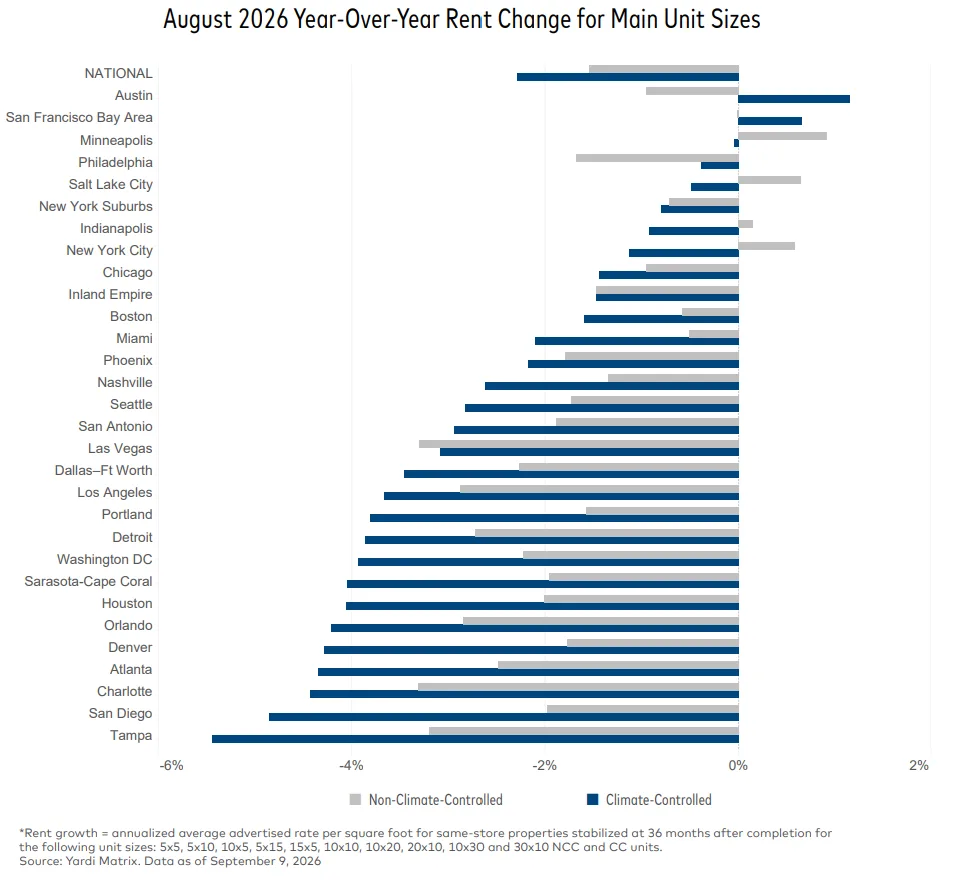
Most of Yardi’s top 30 metros posted deeper annual rent declines than they did in July 2026 or August 2025. Only Austin, Minneapolis, Salt Lake City and the San Francisco Bay Area recorded positive year-over-year advertised rent growth for the main unit mix. On a monthly basis, 24 of 30 metros posted declines. The national rate fell 0.5% from July. That drop was steeper than the pre-Covid average August decrease of roughly 0.2%. Indianapolis, Detroit and San Diego were the only major metros with positive monthly growth.
The Details
Non-climate-controlled rates declined 1.5% year over year, while climate-controlled rents fell 2.3%. REIT advertised rates dropped 3.1% annually and 0.9% month over month. Non-REIT competitors posted smaller declines of 1.2% and 0.3%. Yardi said the difference reflects more responsive pricing by REIT operators during weaker seasonal demand. The pattern extends earlier self storage rent trends as operators respond to soft demand and elevated lease-up inventory.
High-Supply Markets Delay Recovery
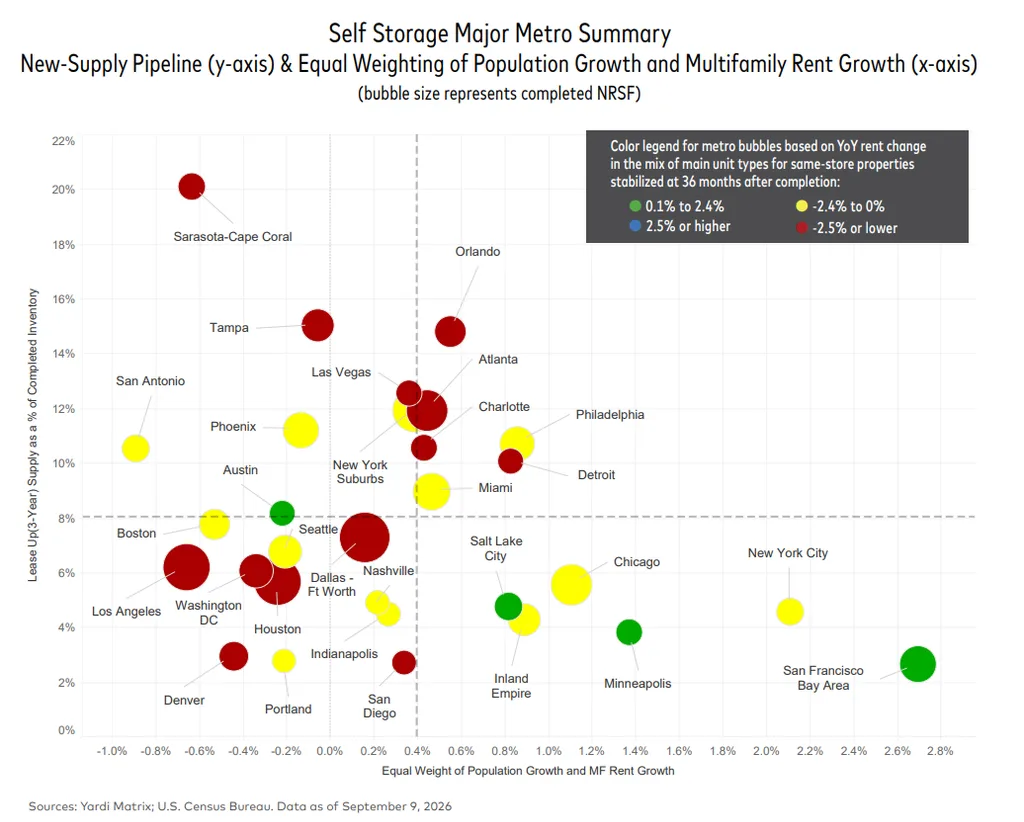
National deliveries over the past three years equaled 8.8% of starting inventory, down from 9.6% a year earlier. Trailing 12-month deliveries represented 2.3%. Several pandemic-era growth markets remain heavily supplied. Sarasota-Cape Coral’s inventory expanded 25.2% over three years, while Tampa grew 17.7% and Orlando 17.4%. Those markets continue to weigh on national performance as new facilities move through lease-up. Their large storage footprints also magnify their influence on national averages.
A Few Markets Still Post Growth
Austin and Minneapolis each posted 0.3% annual advertised rent growth for the main unit mix. Salt Lake City rose 0.2%, while the San Francisco Bay Area gained 0.1%. Yardi said San Francisco combined limited lease-up supply with the strongest population and multifamily rent growth among the top 30 metros. Minneapolis and Salt Lake City also benefited from comparatively modest lease-up supply. Austin remained unusual because positive annual rate growth persisted despite elevated lease-up inventory, although its monthly rate fell 0.8% in August.
Construction Pipeline Keeps Shrinking
About 43.8M net rentable SF were under construction at the end of August, equal to 2.1% of existing inventory. That was down 10 basis points from July and 40 basis points from a year earlier. Across the top 30 metros, under-construction supply declined year over year in 18 markets. Yardi tracks 594 properties under construction, 1,499 planned projects and 299 prospective projects. The report also maintains profiles for 33,283 completed self storage facilities nationwide. Sarasota-Cape Coral and Tampa posted the largest annual declines in under-construction supply among heavily supplied metros.
Why It Matters
The smaller pipeline is a positive supply signal, but it has not yet produced meaningful rent improvement. Existing facilities still need to absorb record levels of recent deliveries in several major markets. National supply delivered from 2023 through 2025 nearly matched the prior 2018 through 2020 peak. This time, the market did not have the Covid-era demand surge that accelerated lease-up. Revenue growth also remains pressured by the wide gap between in-place and street rates. Yardi said occupancy appears to have stabilized, but that has not been enough to restore broader pricing power.
What’s Next
Near-term recovery depends heavily on declining supply and better absorption of lease-up inventory. San Diego shows the two-sided risk. The metro has benefited from limited recent supply, but its under-construction share has more than doubled from 1.4% of stock a year ago to 3.1%. Planned supply has risen to 6.1% as well. Yardi also notes that existing-customer rate increases may contribute less as move-in and move-out activity normalizes. That leaves broader demand and supply absorption as the main recovery drivers.