







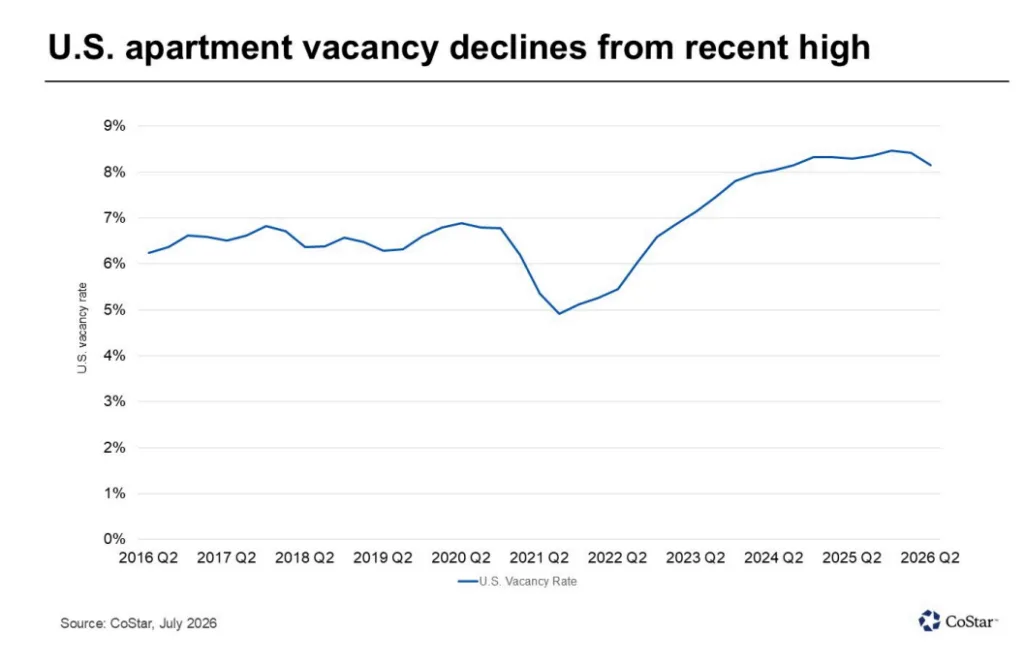
- National apartment vacancy fell to 8.15% in Q2 2026, driven mainly by new supply lease-ups.
- Stabilized assets saw vacancy rates rise, highlighting challenges for existing properties despite headline improvements.
- Regional and market-level splits persist, with luxury and Sun Belt segments showing especially pronounced discrepancies.
New Supply Skews the Vacancy Picture
Globe St reports that newly delivered apartments are distorting the headline vacancy narrative for the US multifamily sector. According to CoStar’s Q2 2026 analysis, national vacancy fell to 8.15%, down 26 basis points from Q1. Vacancy also dropped 14 basis points from the prior year. However, fresh product drove most of that improvement by rapidly absorbing demand. Stronger performance among existing assets played a much smaller role. More than 111,000 units, or nearly 68% of US apartment absorption, came from four- and five-star properties. Many of these properties remain in their early lease-up phases.
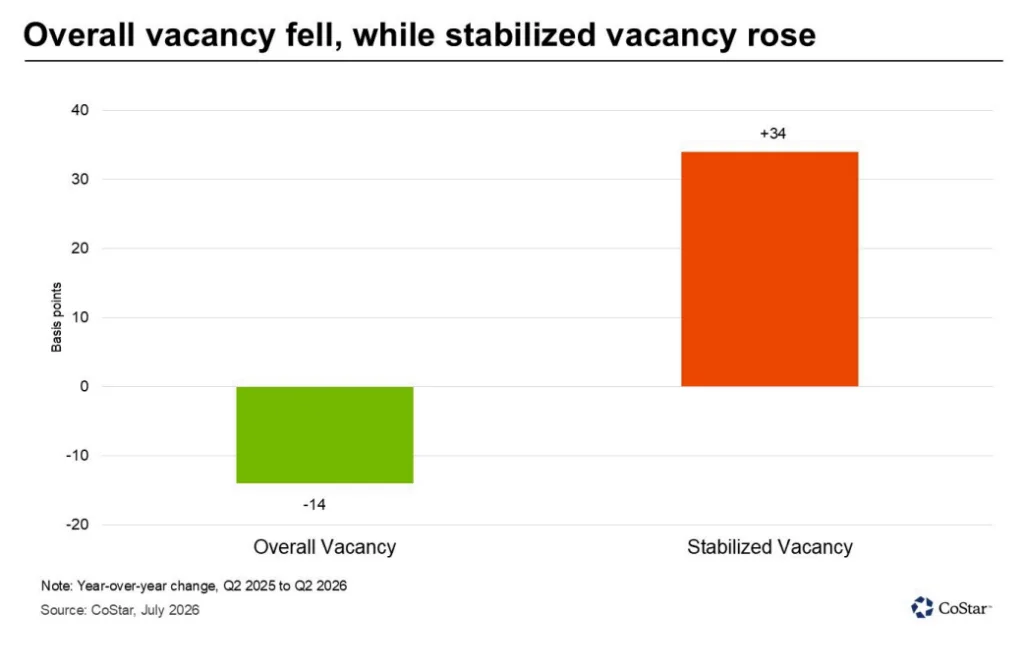
The disconnect is drawing attention from owners and investors. Overall apartment absorption totaled 163,739 units for the quarter, exceeding the 118,047 units added to supply. Yet stabilized properties, those beyond initial lease-up, recorded a 34-basis-point annual increase in vacancy. These figures highlight the uneven impact of new deliveries across the market. They also reveal increasingly divergent performance between new properties and the sector’s established inventory.
Get Smarter about what matters in CRE
Stay ahead of trends in commercial real estate with CRE Daily – the free newsletter delivering everything you need to start your day in just 5-minutes
The Details
CoStar’s data reveals a key divergence between overall and stabilized vacancy. Overall vacancy improved, while stabilized vacancy increased as long-operating communities faced greater leasing pressure. The 48-basis-point spread between both metrics shows that new product is doing much of the heavy lifting. The pattern becomes even sharper among four- and five-star properties. Overall vacancy in this group fell 138 basis points year-over-year. Meanwhile, stabilized vacancy climbed 37 basis points, creating a 175-basis-point gap. Recently completed, well-amenitized communities continue attracting renters as existing luxury assets compete to backfill units.
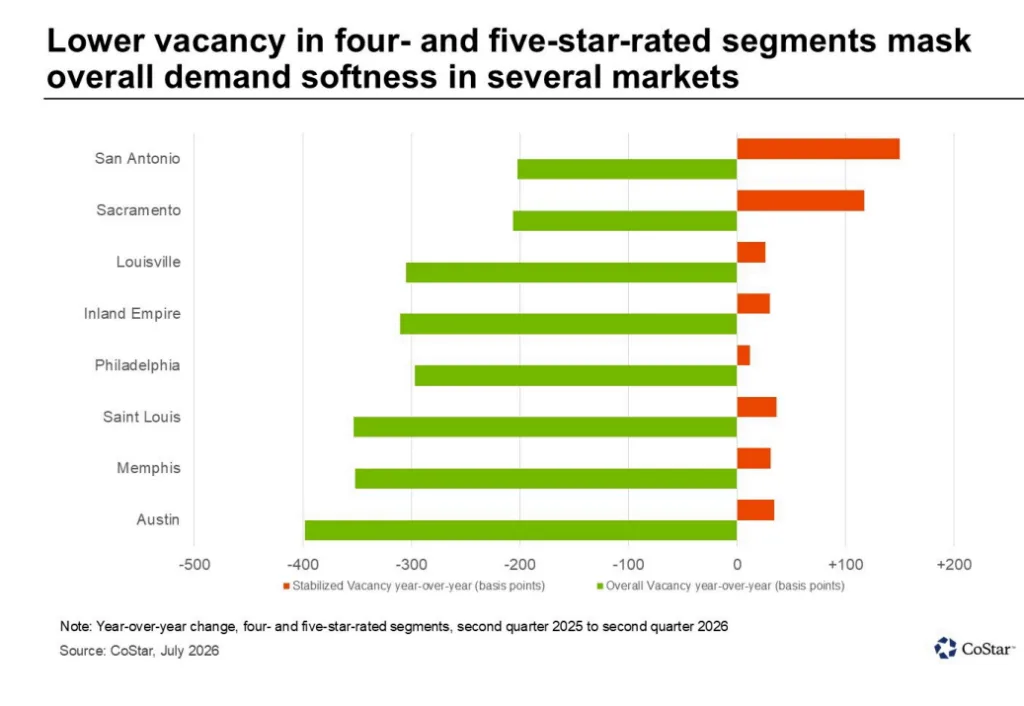
Market splits remain wide. In Austin’s upper-tier segment, overall vacancy fell 398 basis points, while stabilized vacancy increased 34 basis points. San Antonio, Memphis, and St. Louis show similar patterns. Meanwhile, Cincinnati and Cleveland moved against the national trend. Overall vacancy rose 161 basis points in Cincinnati and 121 basis points in Cleveland. These differences show that new demand is not benefiting every metro equally.
Luxury Lease-Ups Outpace Existing Asset Recovery
The headline vacancy decline is masking a two-speed recovery. Most new demand is flowing toward recently built luxury developments, leaving stabilized apartments behind. Nearly 164,000 units recorded net absorption during Q2. High-end, recently delivered buildings captured close to 70% of that demand. New apartment deliveries also continue commanding rent premiums, reinforcing renters’ willingness to pay more for newer properties. However, this segment also carries the highest overall vacancy rate at 10.2%. Strong absorption therefore reflects substantial vacant new supply rather than broad tenant growth across the market. In several high-growth Sun Belt cities, new luxury supply is crowding established assets. That competition is weakening occupancy at older properties.
The Northeast and Pacific regions continue to record the tightest conditions, with average vacancy below 6%. By comparison, the South and Mountain regions both exceed 10% vacancy. These regions also received much of the recent development wave. Despite strong absorption, every major region recorded higher stabilized vacancy than one year earlier. New deliveries are performing well, but those gains have not yet produced broader portfolio stabilization.
Why It Matters
The widening gap between overall and stabilized vacancy signals deeper challenges for operators and investors focused on established properties. A declining national vacancy rate typically indicates healthier leasing conditions. However, CoStar’s analysis shows that existing inventory has captured little of the improvement. Stabilized vacancy increased 34 basis points over the year. In some luxury segments, the gap between overall and stabilized vacancy exceeds 170 basis points. This divergence affects pricing power, renewal rates, and investment strategies. Renters continue showing stronger preferences for new or heavily amenitized properties.
Regionally, the mismatch requires investors to make more granular capital and operational decisions. The South and Mountain regions absorbed much of the recent supply wave. However, stabilized assets there now face sustained vacancy pressure and greater margin risk. Northeast and Pacific investors also face challenges despite tighter overall conditions. Every major region recorded higher stabilized vacancy, including regions where overall vacancy declined. Asset managers must understand these differences when underwriting, budgeting, and planning repositioning strategies.
Market-level outliers like Cincinnati and Cleveland show that supply and demand conditions vary considerably across metros. Vacancy can rise even without substantial new construction. That makes tracking both macroeconomic and local demand signals increasingly important. The current supply wave is entering its later stages. Competition for renters among stabilized, non-trophy properties could define leasing risk and performance volatility across many metros.
What’s Next
Headline vacancy could keep improving as markets deliver and absorb more new supply during the coming quarters. Rapidly growing metros may lead that trend. However, most existing properties are unlikely to experience immediate relief. Stabilized vacancy could remain elevated into 2027. Regions with aggressive construction pipelines and slowing rent growth face the greatest pressure.
Investors and operators will increasingly focus on tenant retention and repositioning aging assets. They may also deploy incentives more strategically to protect occupancy and compete with newer properties. The continued flight toward new apartments will shape portfolio strategies and market performance. How quickly stabilized assets recover will determine whether headline improvements eventually spread across the broader multifamily market.