


- CRED iQ’s analysis of $26.1B in 2026 CMBS loans reveals cap rates now closely match mortgage coupons across most property types.
- Hospitality, office, and retail deliver positive leverage, but manufactured housing, mixed use, self storage, industrial, and multifamily all show negative leverage.
- Multifamily and industrial sectors face cap rate floors dictated by debt costs, while conservative underwriting restricts office and hospitality lending to only the strongest assets.
Cap Rate and Coupon Alignment Defines 2026 CMBS Market
CRED iQ’s latest analysis, as reported by Michael Haas, breaks down $26.1B in loans securitized in 2026 across CMBS conduit, SASB, Freddie Mac, and CRE CLO deals. The data shows average cap rates on newly originated collateral now nearly equal average mortgage coupons. This means the typical 2026 borrower in core sectors is securing debt at zero or even negative leverage—where debt costs equal or exceed property yields. Separating out the winners and losers comes down to property type, with market risk and lender discipline driving a clear divide.
Cap rates for 2026 loan originations vary from 5.41% in manufactured housing up to 8.02% for hospitality, while corresponding coupons range from 5.64% for multifamily up to 6.78% for hospitality. The result is a market split nearly in two: only select sectors see positive leverage, while others require underwriting to future growth or refinancing hopes to justify the debt stack.
Get Smarter about what matters in CRE
Stay ahead of trends in commercial real estate with CRE Daily – the free newsletter delivering everything you need to start your day in just 5-minutes
The Details
According to CRED iQ, 2026 CMBS new-issue cap rates by sector come in at: hospitality (8.02% cap, 6.78% coupon), office (7.45%, 6.50%), retail (6.81%, 6.61%), mixed use (6.10%, 6.53%), industrial (6.03%, 6.33%), self storage (5.70%, 6.05%), multifamily (5.45%, 5.64%), and manufactured housing (5.41%, 6.27%). Subtype dispersion is even starker—super-regional malls cap at 8.94%, while garden multifamily caps at 5.51%. Notably, full-term interest-only loans account for 56% of new-issue balance, indicating borrowers are seeking maximum cash flow as leverage spreads thin. Office and hospitality deals that make it to market are highly conservative, with office averaging a 13.8% weighted debt yield and just 55.4% LTV. By contrast, multifamily averages a 9.6% debt yield and 62.9% LTV; Freddie Mac executions price about 145 basis points inside conduit deals, giving agency-backed multifamily a distinct advantage.
The Negative Leverage Divide
The line between positive and negative leverage is now determined almost entirely by property category.
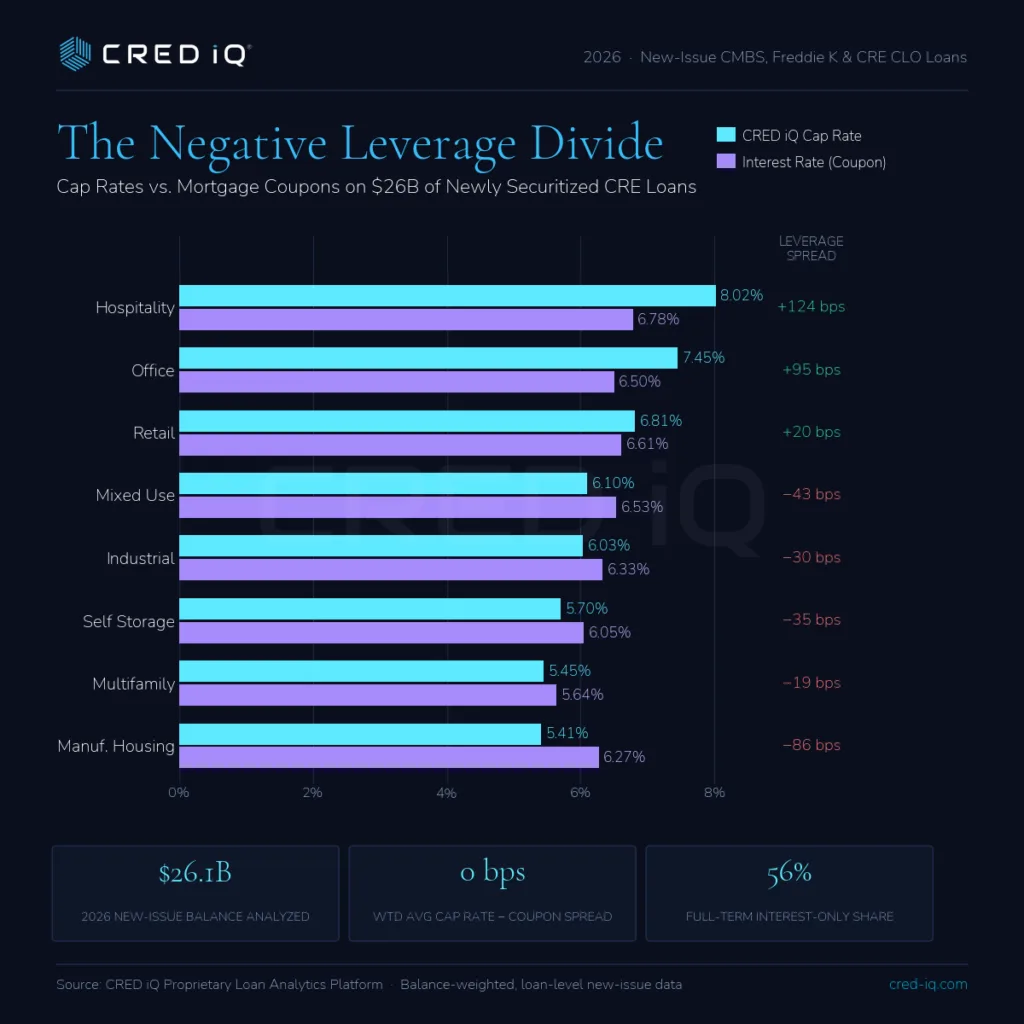
Manufactured housing (−86 bps), mixed use (−43 bps), self storage (−35 bps), industrial (−30 bps), and multifamily (−19 bps) are all financing at coupons above in-place cap rates, per CRED iQ. These asset classes—often considered lower risk and more liquid—are only getting debt on the bet that future NOI growth or a refinancing opportunity will save the day. Meanwhile, hospitality (+124 bps), office (+95 bps), and retail (+20 bps), all sectors with higher inherent operational or leasing risk, now feature wide positive leverage spreads. The spread widens further within asset subtypes, illustrating how lenders continue to price risk—and highlight where price discovery is finally clearing deals.
Why It Matters
Cap rates and debt coupons now nearly converge, setting a new baseline for 2026 CRE finance. According to CRED iQ, most borrowers now face either zero or negative leverage. Debt costs are eating into property yields, leaving little room for easy gains. As a result, sponsors in favored sectors like industrial, multifamily, and manufactured housing need clear growth plans. They must grow in-place performance or count on lower rates by loan maturity. Borrowers also structured 56% of new-issue loans as full-term interest-only. That shows a clear push to maximize immediate free cash flow as spreads tighten.
For office and hospitality, lenders now control the terms. Only best-in-class assets with strong tenancy, low leverage, and robust NCF yields are getting capital. Office deals average LTVs as low as 55%. Meanwhile, office and hospitality both show 13.8% NCF yields. This mirrors earlier CMBS market data showing rising debt yields alongside growing negative leverage pressure. Freddie Mac also gives multifamily a clear funding edge over conduit lending. Agency multifamily loans carry a 4.98% average coupon, while conduit deals carry 6.44%. That gap could shape new supply, refinancing risk, and borrower strategy if rates stay elevated.
Broadly, the data confirms that debt costs now set the cap-rate floor. Multifamily and industrial cap rates may not compress much unless coupons fall meaningfully. Conversely, hotels, office, and malls show where pricing has already adjusted to lender demands. Those wider positive leverage spreads may also show where risk capital can find reward.
What’s Next
For the rest of 2026, one question matters most. Can falling rates or real NOI growth rescue negative leverage sectors? If the Fed cuts, multifamily and industrial cap rates could finally compress. Until then, debt costs remain a high hurdle. Investors and lenders will watch the $26.1B in recent deals closely. Those deals will help set valuation, refinancing, and credit risk expectations. Meanwhile, tighter credit standards and coupon-anchored cap rates may push opportunistic capital toward distressed assets. Transitional properties may also draw more attention, especially in sectors with wide positive leverage spreads.