


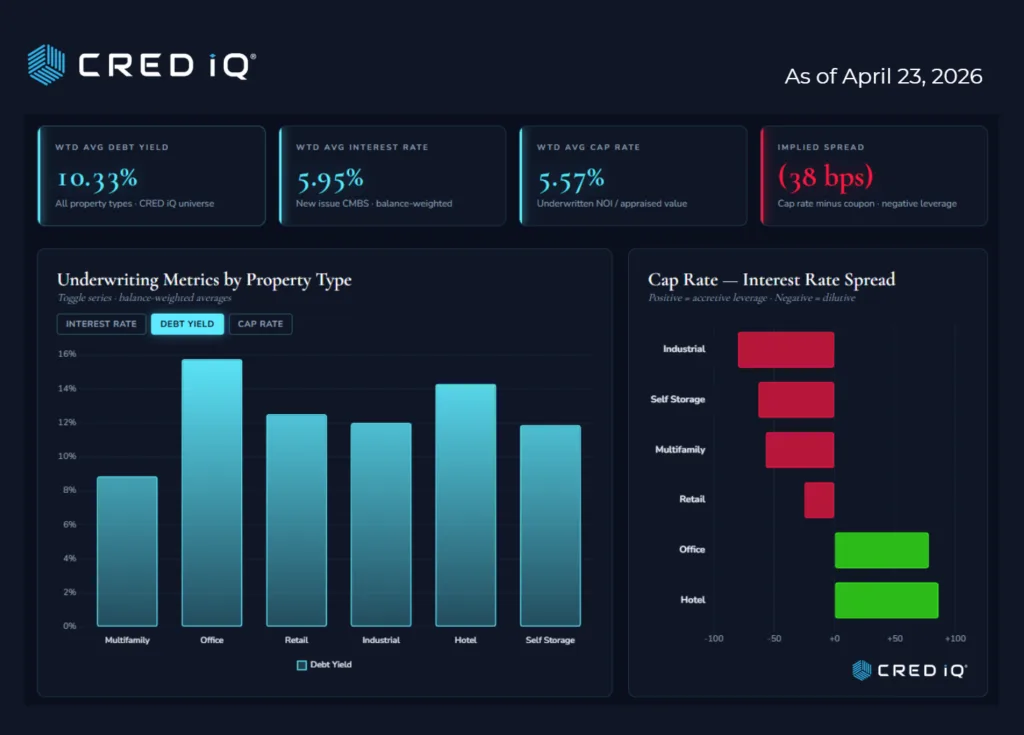
- Debt yields across CMBS loans have rebounded to a 10.3% average, signaling stricter lender underwriting standards.
- Negative leverage persists across most property types, with only office and hotel showing positive spreads.
- Multifamily continues to see the lowest debt yields and most favorable pricing, while office faces the highest lender scrutiny.
CRED-IQ reports that lenders are tightening their grip on commercial real estate credit, but higher borrowing costs continue to challenge deal economics. A new loan-level analysis from CRED iQ shows debt yields rising across CMBS originations—even as most property types remain stuck in negative leverage territory.
A Reset in Underwriting
Across roughly 3,700 CMBS loans totaling $94.7B, debt yields have climbed to a balance-weighted average of 10.3%. That marks a notable shift toward more conservative underwriting, as lenders prioritize stronger income coverage amid persistent rate volatility.
Office properties lead the pack with a 15.75% debt yield, reflecting ongoing leasing uncertainty and elevated risk. Hotels follow at 14.3%, while retail, industrial, and self-storage cluster around the low teens. Multifamily trails at 8.87%, largely due to agency-backed lending and tighter leverage constraints.
Rates Still Driving the Market
Borrowing costs remain elevated across all asset classes. CMBS note rates range from 5.8% for office to 7.33% for hotels, with most sectors landing just above 6%.
This spread underscores how lenders are pricing risk: multifamily continues to benefit from strong liquidity and government-sponsored backing, while hotels command a premium due to income volatility. At the same time, softer rent growth and rising concessions in many apartment markets are reinforcing a more cautious outlook for the sector’s near-term performance. Other sectors—retail, industrial, and self-storage—sit in a narrow middle band.
The Negative Leverage Problem
Despite improved debt yield discipline, most acquisitions still don’t pencil on day one. Multifamily, retail, industrial, and self-storage all show cap rates below borrowing costs, resulting in negative leverage.
Industrial stands out in particular. Strong fundamentals have compressed cap rates to around 5.35%, but financing costs exceed 6%, creating one of the widest gaps. In contrast, office and hotel assets offer positive leverage, though that comes with significantly higher risk profiles.
Get Smarter about what matters in CRE
Stay ahead of trends in commercial real estate with CRE Daily – the free newsletter delivering everything you need to start your day in just 5-minutes
What Cap Rates Are Signaling
Cap rates across the dataset average 5.57%, with relatively tight dispersion among core asset classes. Multifamily and industrial remain closely aligned from a valuation standpoint, suggesting appraisers still view them as comparable institutional assets—even as their financing dynamics diverge.
Hotels and office assets trade at higher cap rates, reflecting risk premiums tied to operational volatility and uncertain demand.
Why It Matters
The data points to a market still in transition. While lenders have reestablished discipline through higher debt yields, borrowers are increasingly relying on future NOI growth or refinancing assumptions to justify acquisitions.
Until either cap rates expand or borrowing costs decline, negative leverage will continue to define CRE transactions—keeping pressure on returns and limiting accretive deal flow.
What’s Next
For now, the gap between cap rates and interest rates remains the market’s central tension. Unless the yield curve shifts or valuations adjust, most deals will continue to depend on forward-looking assumptions rather than immediate cash flow.
That dynamic suggests a slower, more selective investment environment ahead—where only the most resilient asset classes and well-capitalized buyers can thrive.