


- New industrial supply fell 24% year over year, while net absorption jumped 19% in the top 25 US markets.
- Vacancy rates remain elevated at 7.2% for the largest logistics hubs, but the rate of increase has slowed.
- Sun Belt markets lead in both inventory growth and leasing, while more balanced conditions set up for rent gains in tight markets.
Supply Resets After Pandemic-Fueled Boom
According to Colliers’ June 2026 US research report, the era of outsized industrial development that followed COVID-19 has ended decisively. New inventory in the top 25 industrial and logistics markets is down 24% from last year, and nation-wide construction activity is now 60% below its 2022 high.
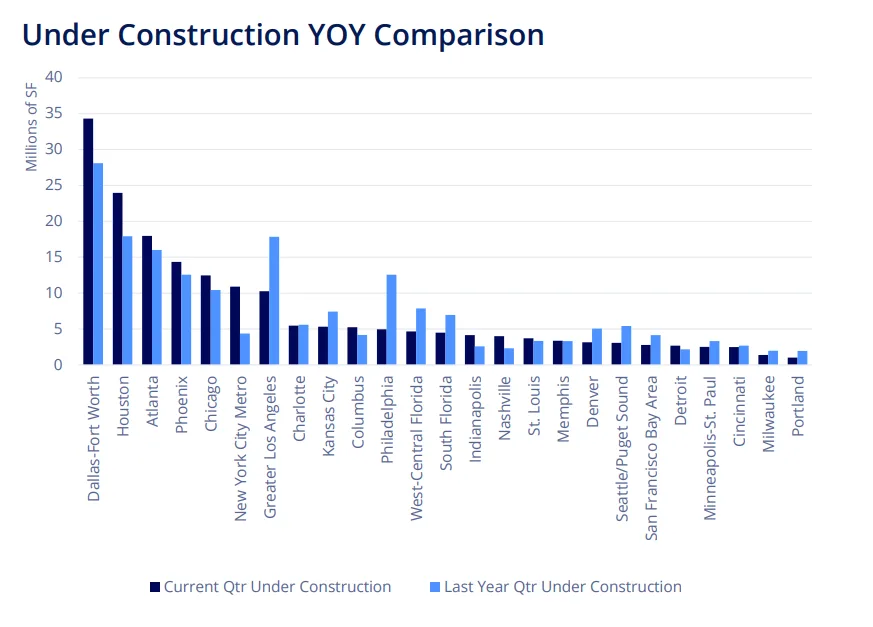
Source: Colliers
As borrowing costs, absorption trends, and tenant caution pressured developers through 2025, pipelines reset for the first time in years. This correction, while abrupt, has already begun shifting national fundamentals out of an oversupplied posture toward greater balance—laying groundwork for healthier vacancy, renewed speculation, and firmer rents in the cycle ahead.
Colliers finds these top 25 markets, which comprise 76% of US industrial inventory, are setting the pace for the sector’s recovery. Recent numbers show that development and leasing are increasingly concentrated in high-growth Sun Belt and Midwest hubs. This means market momentum will depend on how quickly these leading cities absorb leftover space and attract new tenants as speculative construction restarts.
Get Smarter about what matters in CRE
Stay ahead of trends in commercial real estate with CRE Daily – the free newsletter delivering everything you need to start your day in just 5-minutes
The Details
Over the past four quarters, the 25 largest US industrial markets added 183.5M SF of new product, compared to 266.5M SF nationwide. That’s a 24% drop from the previous period, per Colliers. Dallas–Fort Worth and Houston once again led completions (22.3M SF and 20.1M SF, respectively), while Greater Los Angeles and Atlanta remained national outliers at 17.3M SF and 11.4M SF.
Vacancy across the top 25 markets edged up to 7.2%—an increase of just 11 basis points year over year (vs. a national rise of 37 bps). In Indianapolis, net absorption outpaced new supply nearly fourfold (15.7M SF taken vs. 3.9M SF delivered), tightening vacancy rates and supporting above-average rent growth potential in quarters ahead. Meanwhile, marketplace activity fanned out: demand strengthened in 15 of the top 25 metros, and the Sun Belt remained the epicenter of both deliveries and leasing.
Sun Belt, Midwest, and Demand-Led Recovery
Nationwide, net absorption—an indicator of industrial demand—rose 5.2% (to 186M SF), but the 25 leading markets saw a robust 19% jump to 146M SF, per Colliers. Dallas–Fort Worth topped all markets with 24.3M SF of net absorption, followed by Phoenix (18.5M SF), Indianapolis (15.7M SF), Chicago (14.2M SF), and Houston (13.8M SF).
Inventory growth decelerated sharply, from a 5.9% year-over-year high in late 2023 to just 0.5% over the past 12 months nationally; the top 25 markets registered a 1.3% pace. Remarkably, Texas and Southeast hubs continued to grow: Nashville (4.1% inventory jump), Houston (3.3%), Phoenix (2.6%), and Dallas–Fort Worth (2.1%) led all markets for new space, even as supply pipelines overall retrenched. Demand now outpaces construction in 11 of the leading metros, compressing excess capacity and reinforcing a tightening cycle most visible in the Midwest and select Sun Belt regions.
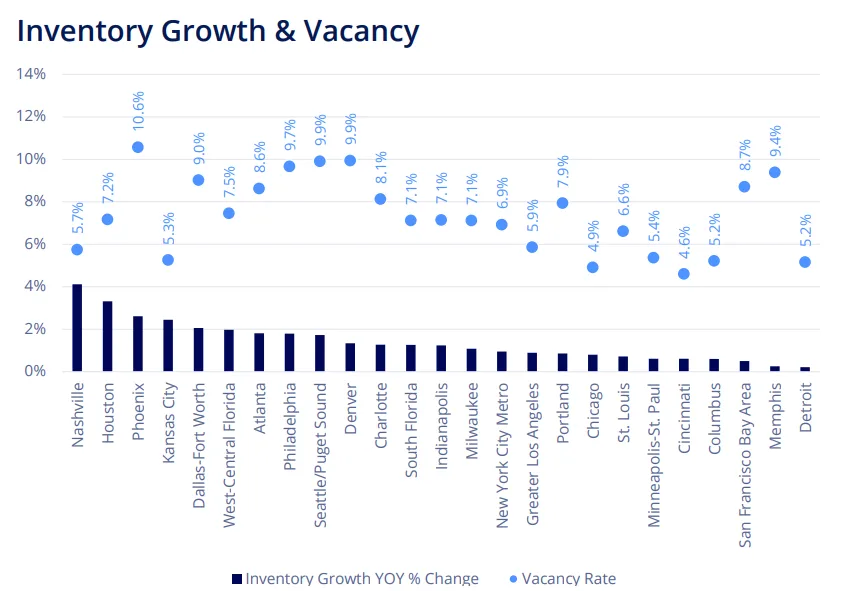
Source: Colliers
Why It Matters
The abrupt slowdown in new industrial supply, juxtaposed with a rebound in net absorption, flips the script from 2023’s overbuilt landscape to a more landlord-favorable environment in 2026. Tenants in top logistics markets now face shrinking big box availability and flattening vacancy levels. According to Colliers, eight major markets saw vacancy rates fall year over year, with Indianapolis posting a 364 basis point drop to 7.1%—after peaking at 11.2% just 18 months prior.
This broad-based improvement isn’t universal: West Coast and some Northeast metros (e.g., Philadelphia, Seattle/Puget Sound, San Francisco Bay Area) logged the largest year-over-year vacancy increases, and move-outs outpaced move-ins in seven of the 25 markets. Nonetheless, with national pipelines at just 40% of their 2022 peak, developers are gaining confidence to restart speculative projects where absorption supports it. That renewed confidence mirrors improving sentiment across commercial real estate, as stronger deal activity encourages investors to reengage despite lingering market uncertainty.. Rent growth remains lumpy—Houston leads at +14.2%, while Greater Los Angeles saw rents fall 8.5%—but the return to equilibrium suggests future rental bumps as tenants exhaust the last of move-in-ready, modern space.
With nearly 70% of US industrial metros reporting positive absorption in Q1 2026, a broadening demand base combined with suppressed construction ultimately bodes well for landlords looking to recoup ground lost during the pandemic surge in new supply. Even average asking rents nationally, which declined 0.5% to $10.46 PSF over the year, are stabilizing: the largest markets actually saw a 0.8% rent rise, to $9.72 PSF.
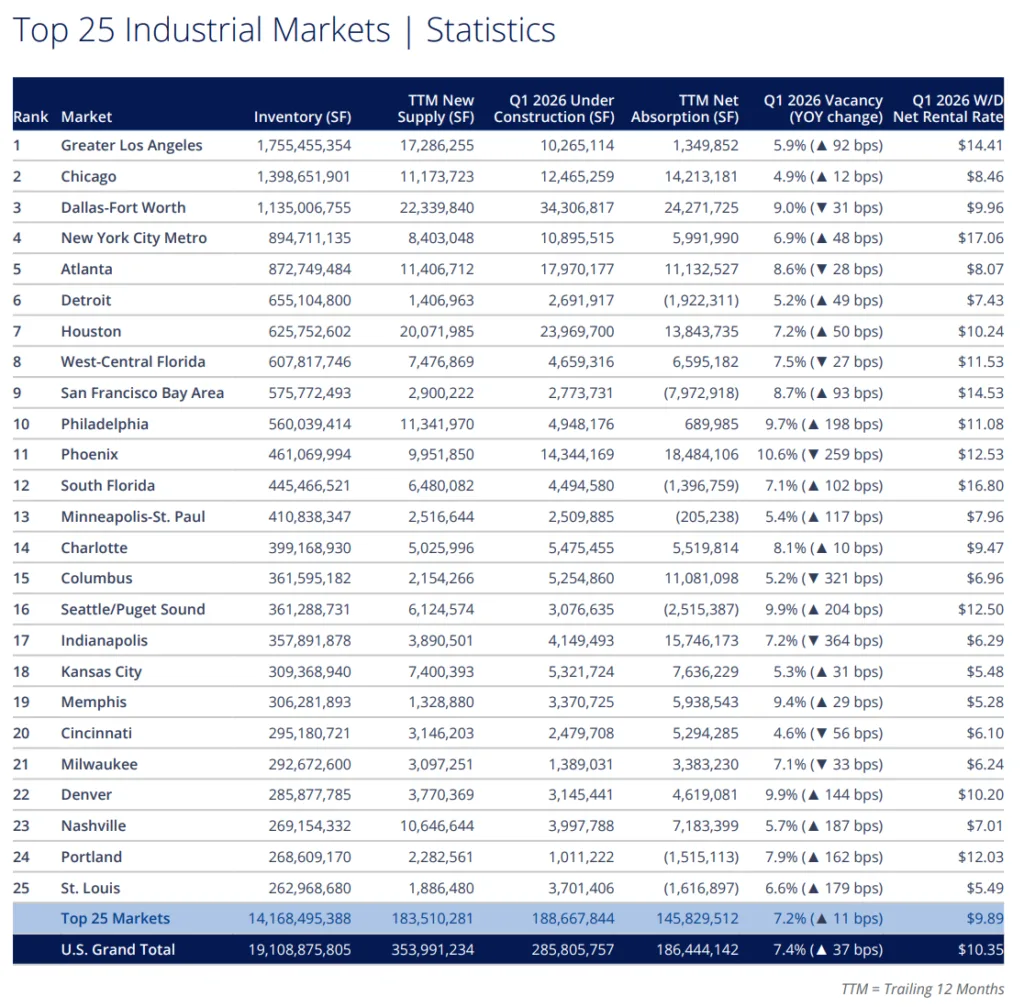
Source: Colliers
What’s Next
The 2026 outlook for US industrial real estate points to further tightening, especially in logistics hubs where occupier demand eclipses under-construction volume. Colliers expects speculative development activity will cautiously expand, mainly in box-ready facilities where available choices are already scarce. While construction pipelines (now 286M SF, up slightly from the 2025 low but still 60% below peak) are expected to stay subdued through year-end, improved economic clarity and a broad-based absorption recovery could reset the stage for moderate inventory growth beginning in late 2026. The Sun Belt, Midwest, and large distribution centers are best positioned for above-average rent gains and supply-demand balance as the sector transitions out of its post-pandemic reset.