






- The US coworking sector grew 2.7% in Q2 2026, reaching 9,384 locations, as expansion shifted toward smaller, secondary markets.
- Despite a rise in locations, national coworking square footage increased only 1.5%, with average space size dropping by 1.2% to 17,728 SF.
- Prices remained stable overall, with the median monthly membership at $219, but market-level price swings persist, especially in virtual office subscriptions.
Secondary Markets Power Expansion
According to CoworkingCafe’s latest Q2 2026 report, the US coworking industry recorded another quarter of solid expansion. The number of locations increased 2.7% from Q1, bringing the nationwide total to 9,384 flex offices.
Operators added 248 net locations across the country during the quarter. While established hubs maintained steady growth, secondary and tertiary markets increasingly drove the industry’s broader expansion.
The South now represents more than a third of the top 50 coworking markets. Washington, D.C., Dallas, and Atlanta helped lead the region’s expansion.
Meanwhile, Indianapolis and Salt Lake City posted some of the largest percentage gains. This momentum signals growing demand beyond gateway metros and across previously underserved markets.
Get Smarter about what matters in CRE
Stay ahead of trends in commercial real estate with CRE Daily – the free newsletter delivering everything you need to start your day in just 5-minutes
The Details
From April through June 2026, operators added 248 net coworking locations across the US. CoworkingCafe and Yardi Matrix data tracked this continued expansion.
National flex office square footage increased from 163.94M to 166.36M SF, representing 1.5% growth. However, the average space size declined to 17,728 SF.
Regionally, the South leads with 2,640 flex offices, followed by the West with 2,056 locations. The Northeast has 1,419 locations, while the Midwest has 1,114.
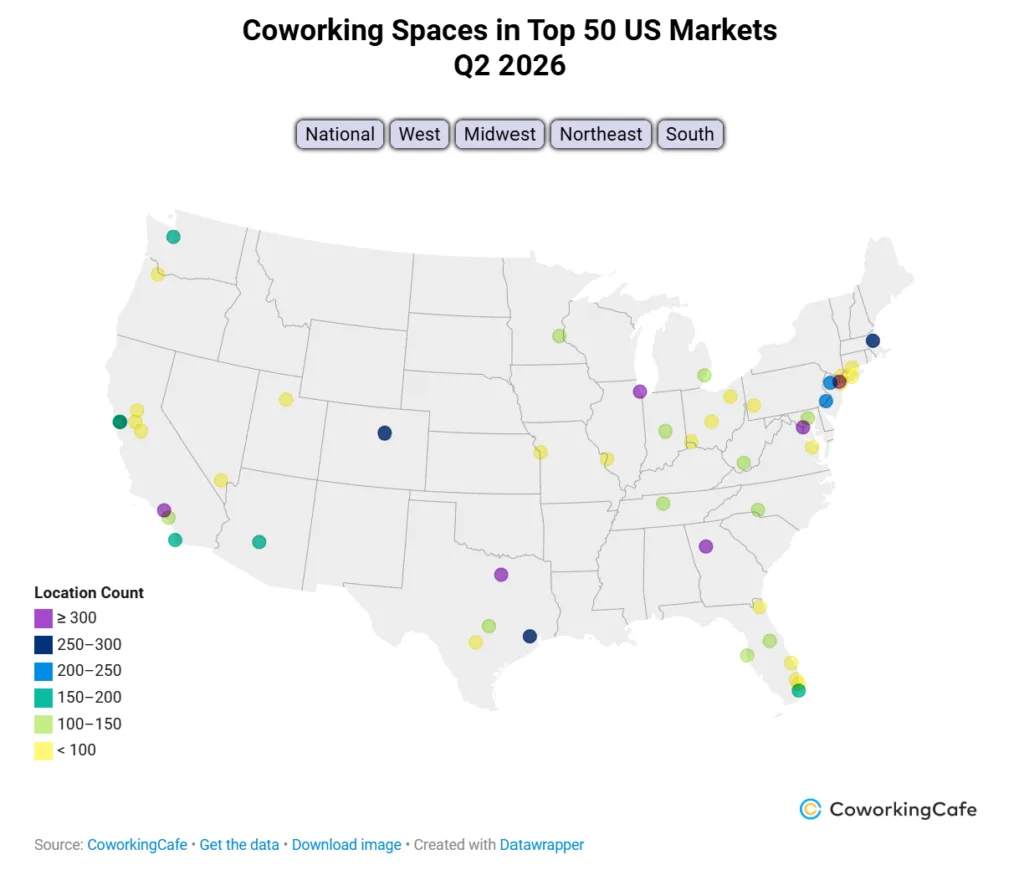
Los Angeles remains the largest coworking market by location count, with 349 spaces despite a 1% contraction. Chicago moved into second place after growing 3% to 346 locations.
That growth pushed Chicago slightly ahead of Dallas-Fort Worth, which has 338 spaces. Indianapolis jumped 14% and surpassed 100 locations during the quarter.
Philadelphia, Phoenix, and Seattle also recorded healthy inventory gains. Together, these markets show that coworking expansion continues spreading across different regions.
Coworking Growth Outpaces Square Footage
Yardi data shows location growth consistently outpaced new square footage additions. This trend appears strongest across emerging and secondary markets.
Smaller, more agile coworking sites continue expanding across these areas. The average coworking space size declined 1.2% quarter-over-quarter, reinforcing the shift toward compact, community-focused models.
Still, top-tier metros maintain a dominant position in total coworking square footage. Manhattan leads with 12.56M SF despite recording a 2% quarterly decline.
Chicago now has the second-largest footprint at 9.27M SF after growing 2%. Los Angeles ranks third with 7.51M SF following a 3% decline.
Indianapolis recorded 10.3% square footage growth, while Philadelphia increased 8%. Columbus followed closely with a 7.6% increase.
These markets expanded both their location counts and overall space allocations. Their growth highlights rising coworking demand beyond traditional gateway cities.
Why It Matters
Changing coworking growth patterns reflect a broader transition in US office demand. Large, full-service spaces remain popular across gateway metros.
However, smaller markets increasingly attract users seeking flexible, right-sized options. Coworking now represents 2.3% of national office supply.
The sector has also shifted toward efficiency, as operators increasingly prioritize stronger locations and sustainable footprints over aggressive expansion.
That share increased from 2.28% during Q1. Meanwhile, national coworking pricing remained relatively stable during the quarter.
Median memberships declined $1 to $219 monthly, while day passes increased to $34. Meeting room rates remained unchanged at $45 hourly.
Manhattan remains the membership pricing leader at $339 monthly. Brooklyn follows closely at $320, showing persistent demand despite intensifying competition.
Major and secondary markets across the Sun Belt and East Coast now share $235 median membership rates. More affordable options remain available elsewhere.
Columbus and St. Louis both offer median memberships around $150. Virtual office pricing shows considerably more volatility across individual markets.
For example, Atlanta recorded a $43 increase in virtual office pricing during Q2. Operators appear to be adjusting offerings based on local conditions.
These trends reveal a growing divide across the coworking industry. Core cities favor Class A, amenity-heavy spaces, while localized operators fill gaps elsewhere.
Major chains still maintain significant scale across the national market. Regus operates 1,285 locations nationwide, while HQ maintains another 388.
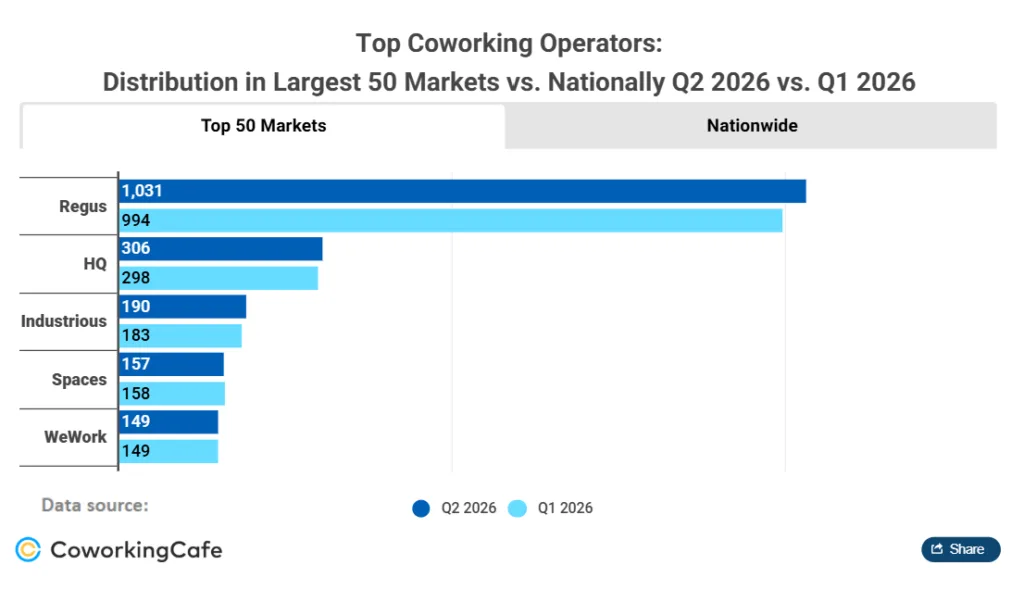
However, independent operators now run more than three-quarters of US flex offices. That concentration highlights the increasingly decentralized nature of coworking.
What’s Next
Coworking momentum could continue through the remainder of 2026. Secondary and tertiary metros appear positioned to deliver above-average growth.
Yardi’s Coworking Index now tracks more than 120 markets through monthly updates. Its data highlights continued flex demand growth beyond premier coastal cities.
Regional centers increasingly capture users seeking flexibility and smaller footprints. Meanwhile, operators continue adapting to a stabilizing post-pandemic office supply environment.
Operators will likely test smaller formats, hybrid-oriented spaces, and localized pricing strategies. These approaches could help capture evolving demand across different markets.
Further pricing differentiation could emerge in virtual offices and day passes. Local competition and operator scale will shape the next wave of expansion.