


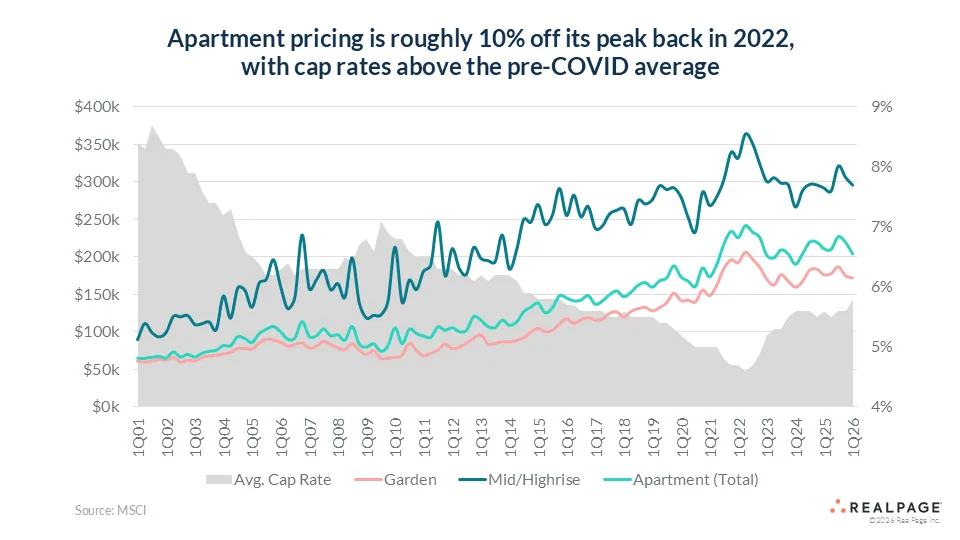
- Apartment asset values have repriced—down about 10% nationally from 2022 peaks—masking significant regional and class-based variation.
- Sun Belt workforce housing and Class C assets have seen value drops up to 30%, while coastal and Class A properties show smaller declines and higher price per unit.
- The market is moving away from a single national pricing narrative, with local fundamentals and asset positioning increasingly driving transaction activity and performance.
Pricing Divide Widened by Geography and Asset Class
According to the RealPage Analytics Blog, the ongoing apartment repricing has amplified differences across markets and product types. While nationwide asset values are down approximately 10% from 2022’s peak, stabilized, high-quality Class A properties have weathered the reset with only 7% to 8% declines. However, oversupplied Sun Belt metros—especially among workforce housing and Class C stock—have seen value drops as steep as 20% to 30%, driven by increased financing costs, bigger concessions, and rising expenses. The upshot: broad averages no longer tell the whole story. Where, what, and how you own matters more than ever.
Get Smarter about what matters in CRE
Stay ahead of trends in commercial real estate with CRE Daily – the free newsletter delivering everything you need to start your day in just 5-minutes
The Details
Current market clearing cap rates for stabilized apartment deals typically range from 5.25% to 5.5%, signaling a firm break from the low cap rate, pre-2022 environment. Urban mid- and high-rise assets have experienced greater volatility, giving back more ground after aggressive peak-era pricing than their suburban, garden-style counterparts.
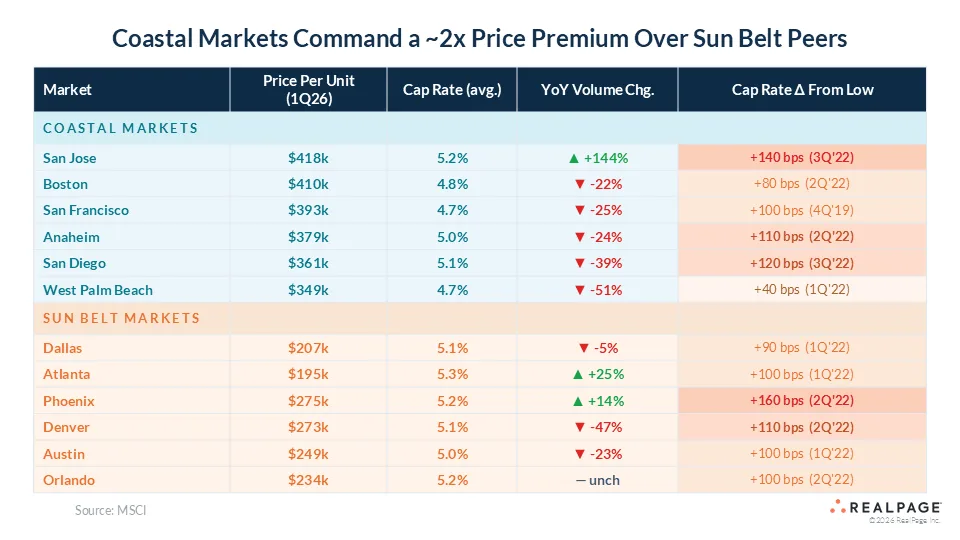
Geography is just as consequential: price per unit for coastal assets is about $400,000, double the $200,000 average in the Sun Belt. Yet, despite this pricing gulf, cap rates for both regions remain surprisingly close, mostly due to stronger rent levels sustaining higher coastal valuations.
Transaction Volumes and Market Leaders
Regional comparison highlights further complexity. San Jose stands out among coastal markets—sales activity there has jumped 144% year-over-year, largely attributed to the city’s pivotal role in the expanding AI sector, which attracts both new capital and corporate demand. Other coastal metros lag, down 20%–40% in volumes as buy-sell price gaps linger. That resilience mirrors stronger apartment fundamentals in several coastal markets, where rent growth has recently outpaced many Sun Belt peers. In the Sun Belt, Atlanta is a rare outlier with a 25% uptick in transaction volume, while cities like Austin and Denver remain on the back foot due to ongoing supply overhang, putting more pressure on market fundamentals than downward price adjustments alone can offset.
Why It Matters
The widening gap in apartment valuations marks a shift from a cycle driven by national trends. Rising debt costs, shifting capital flows, and operating pressures now drive sharper differences across markets and asset classes. As a result, Sun Belt workforce housing faces some of the steepest price resets. Investors must scrutinize rent growth assumptions and expense projections more closely.
Meanwhile, the narrow cap rate spread between coastal and Sun Belt markets reflects confidence in premium locations. Strong rents continue to support coastal valuations despite higher interest rates. That dynamic helps explain why some coastal markets retain elevated pricing. However, transaction volumes remain muted in most metros. San Jose remains a notable exception. For CRE professionals, local expertise now matters more than broad sector narratives. Asset quality, market fundamentals, and demand drivers increasingly shape outcomes. Consequently, investors need more granular risk analysis and targeted market strategies.
What’s Next
Pricing recalibration is far from complete. RealPage expects market bifurcation to deepen as buyers and sellers anchor to local data and cycle timing rather than headline trends. Transaction activity will likely concentrate further around markets and assets with resilient demand or special growth stories, such as Atlanta or San Jose. Conversely, oversupplied Sun Belt metros and lower-tier assets could continue to face outsized value declines until rent growth or absorption returns. For the next phase, investors, lenders, and operators will need to differentiate not just by market but by micromarket—and match capital strategies accordingly.