


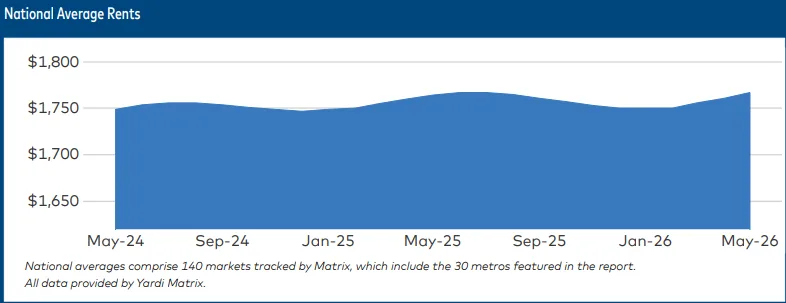
- US multifamily rents rose $6 to $1,767 in May 2026, but year-over-year growth was just 0.2%.
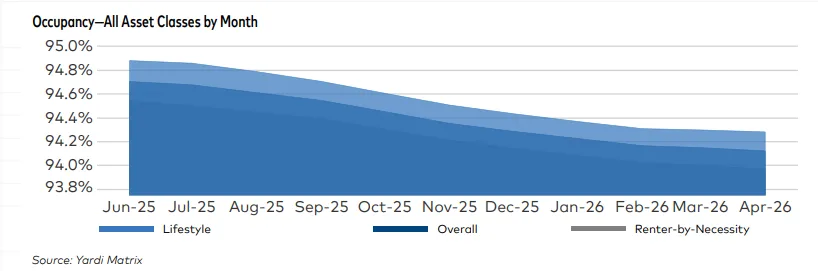
- Occupancy rates fell to 94.1%, the lowest level since 2013, amid ongoing new supply and soft demand.
- Transaction volume remains muted as higher interest rates and wide bid-ask spreads keep sales sluggish.
Small Rent Gains Mark Slower Spring for Multifamily
US multifamily advertised rents increased by $6 in May 2026 to $1,767, according to Yardi Matrix. Yet this modest rise left annual rent growth at 0.2%—well below levels seen before the pandemic, when 2% growth was the seasonal norm between January and May. National occupancy continues to slide, reaching 94.1%, the lowest in over a decade, as robust deliveries and softening demand reshape the market dynamic.
Get Smarter about what matters in CRE
Stay ahead of trends in commercial real estate with CRE Daily – the free newsletter delivering everything you need to start your day in just 5-minutes
Supply Spike and Affordability Squeeze Demand
After a cycle peak in 2022, today’s occupancy rate marks a drop of over 200 basis points, reflecting both a glut of new product and economic headwinds. Elevated supply has intensified competition for tenants, especially as affordability concerns keep many renters on the sidelines. Inflation, boosted by higher energy costs, reached 3.8% in April 2026 per Yardi Matrix, while labor and consumer confidence indicators remain weak. These macro-drivers are delaying Federal Reserve rate cuts, further clouding the transaction outlook.
The Details
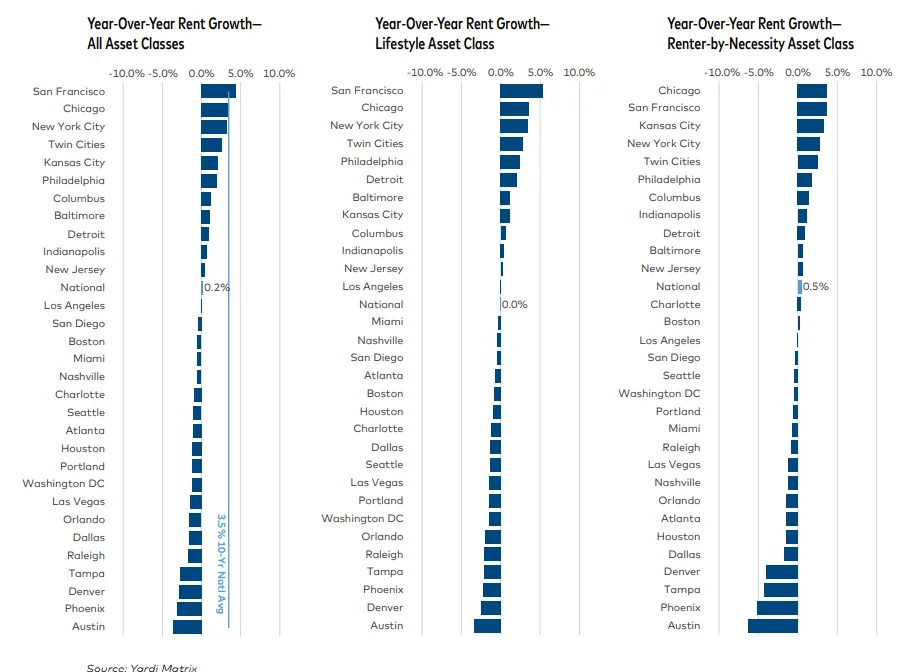
In May, rents advanced 0.3% month-over-month, with most tracked metros posting gains. Lifestyle-class units led performance, rising 0.4% for the month. San Francisco, Chicago, and New York City topped the annual rent growth charts, with San Francisco up 4.5% year-over-year. Meanwhile, Sun Belt and high-supply markets—such as Austin (-3.7%), Phoenix (-3.1%), and Denver (-2.9%)—continued to underperform. National transaction volume reached $26.6B through May, down 10.7% from the $29.8B recorded a year earlier, as wide bid-ask spreads and rising borrowing costs sidelined sellers.
Leasing and Deal Flow Stagnate Amid Rate Uncertainty
Expectations entering 2026 were for increased deal activity driven by lower rates, but persistent inflation and geopolitical instability have pushed Treasury yields above 4.4%. Even as equity remains committed to the multifamily space—Colliers reports $174B invested on a two-year rolling basis—owners are largely waiting for more favorable pricing. Fannie Mae and Freddie Mac remain active in the debt markets, with refinancing activity outweighing new property sales. The lack of motivated sellers and ongoing volatility in loan pricing continue to drag on transaction velocity.
Diverging Metro Performance and SFR Trends
Gateway and Midwest markets lead rent growth, while high-supply Sun Belt metros continue posting flat or negative performance. National SFR rents were flat, but Chicago outperformed Austin and Phoenix by more than 10 percentage points. SFR occupancy held up better than multifamily, though it too has softened, falling to 94.5% as of April.
Why It Matters
Soft rent growth and declining occupancy reflect a market in transition. According to Yardi Matrix, only 12 of the top 30 metros posted positive annual rent growth, with tougher conditions expected in oversupplied and less affordable markets. The growing gap between supply-heavy and demand-driven metros signals that asset selection and local fundamentals will be critical for investors. Meanwhile, the resilience of multifamily as a favored asset class is being tested by global economic uncertainty and the lag in transaction recovery.
What’s Next
Eyes will remain on macro factors: inflation, Fed policy, and the conflict-induced volatility affecting energy prices and consumer confidence. Should geopolitical risks ease and energy prices retreat, consumer sentiment may recover, providing a tailwind to household formation and renting. However, with new supply still hitting the market and financing cost headwinds, expect rent growth to remain modest and leasing to lag until at least late 2026. Investors and operators should closely monitor evolving market bifurcation as the national averages obscure significant local variation.