


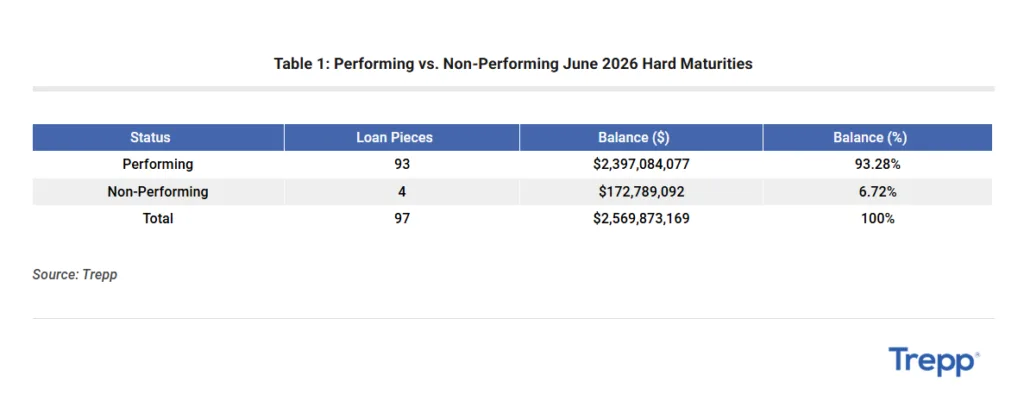
- $2.57B in private label CMBS hard maturities hit in June 2026, with 93% of loans still performing but pockets of stress emerging.
- Office properties face the highest delinquency rate as legacy assets in challenged CBDs report weak cash flow and DSCRs below 1.0x.
- Market risk remains concentrated—refinancing pressure intensifies where valuations are impaired, especially in large regional mall and office loans.
June Wave Reveals Refinancing Friction
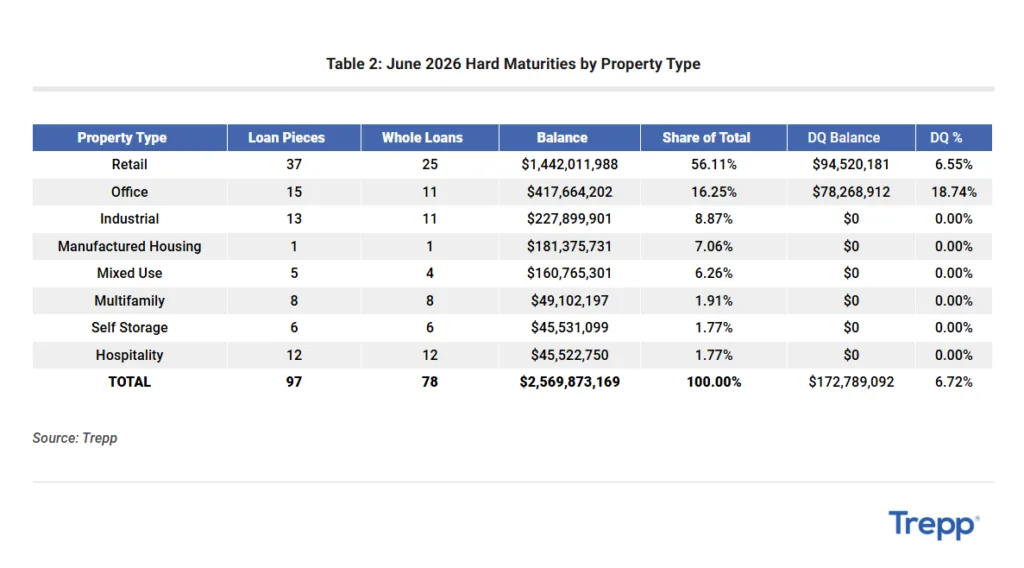
June 2026 CMBS hard maturities total $2.57B across 97 loan pieces, per Trepp’s Hard Maturity Playbook. Of this cohort, 93 loan pieces representing $2.40B are current, but four loan pieces totaling $172.8M, or 6.7%, are non-performing. Hard maturities are loans with no contractual extensions left—so operators must either repay or actively negotiate. This maturity wall excludes assets already taken back by lenders or pushed into foreclosure, spotlighting where active refinancing friction will play out right now.
Get Smarter about what matters in CRE
Stay ahead of trends in commercial real estate with CRE Daily – the free newsletter delivering everything you need to start your day in just 5-minutes
Debt Yields and Sector Headwinds
Per the report, 39% of 2026’s $76.6B in CMBS hard maturities come due in Q4, creating a backloaded risk profile. Troublingly, 36% of these loans feature debt yields at or under 8%, the threshold at which refinancing is most difficult given prevailing lending standards. Office, retail, and multifamily sectors have the largest concentration of such risk. Retail holds the highest dollar volume of maturities, but office displays the highest delinquency percentage—stemming mostly from a handful of legacy urban assets rather than systemic sector-wide distress.
Major Loans Concentrate Maturity Risk
The five largest loans in the June cohort make up about $1.03B, or 40% of the total, including Lakewood Center, Mall at Rockingham Park, U.S. Steel Tower, Holyoke Mall, and IDS Center. While concentration is notable, it’s less severe than in prior waves. Still, several high-profile regional malls and office properties show warning signs: DSCRs falling below 1.0x, recent servicing transfers, extensions ahead of maturity, and, in some cases, no disclosed payoff timeline. Stable payment status at this stage doesn’t ensure a clean resolution—especially if exit plans remain hazy.
Debt Maturities Add Pressure
This cohort isn’t sparking widespread CMBS deterioration, but it does reinforce that credit risk sharpens where weak cash flow, impaired property values, and reduced refinancing options converge. Regional malls are especially exposed: valuation write-downs and inflation-driven expenses eat into cash flow, even with relatively steady occupancy. Office portfolios—particularly older towers in challenged central business districts—continue to see tenant attrition and DSCR declines, putting them on watch for distress well before any payment default.
Why It Matters
The June 2026 CMBS hard-maturity roster is a microcosm of today’s wider CRE refinancing battles. According to Trepp, the hard-maturity wave may not swamp the market, but it reemphasizes that active loan surveillance (beyond headline delinquency data) is essential. Properties facing valuation declines, softening DSCRs, and unproven refinance plans are the likely trouble spots as market liquidity remains tight.
What’s Next
With a heavy calendar of hard maturities stacked toward late 2026, large retail and office assets face mounting refinancing pressure. Property owners and servicers will need to secure new financing or pursue restructurings. Otherwise, cash flow challenges could push more loans into distress. Watch for upticks in servicing transfers, payoff extensions, and potential asset sales as sponsors seek solutions. Deeper credit scrutiny and precise asset-by-asset monitoring will be key as the next wave crests.