



- Multifamily starts reached a seasonally adjusted annual rate of 529,000 units in April, up 23.3% year over year, according to the US Census Bureau and HUD.
- Permit activity strengthened across most regions, led by the Midwest and Northeast, while single-family construction remained largely flat amid high mortgage rates and construction costs.
- Rising starts suggest apartment developers are reactivating projects after a prolonged slowdown, though units under construction continue to decline from peak levels.
According to RealPage, multifamily construction posted one of its strongest monthly gains in more than a year in April, adding another sign that apartment development may be stabilizing after a sharp pullback. According to the latest data from the US Census Bureau and the Department of Housing and Urban Development, multifamily starts climbed to a seasonally adjusted annual rate (SAAR) of 529,000 units in April 2026, up 14.3% from March and 23.3% year over year.
The increase comes as developers navigate a market still dealing with elevated interest rates, tighter lending conditions, and slowing rent growth in several Sun Belt markets. Even so, permit activity and completions data point to improving construction momentum heading into the second half of 2026.
Get Smarter about what matters in CRE
Stay ahead of trends in commercial real estate with CRE Daily – the free newsletter delivering everything you need to start your day in just 5-minutes
A Closer Look At Multifamily Starts
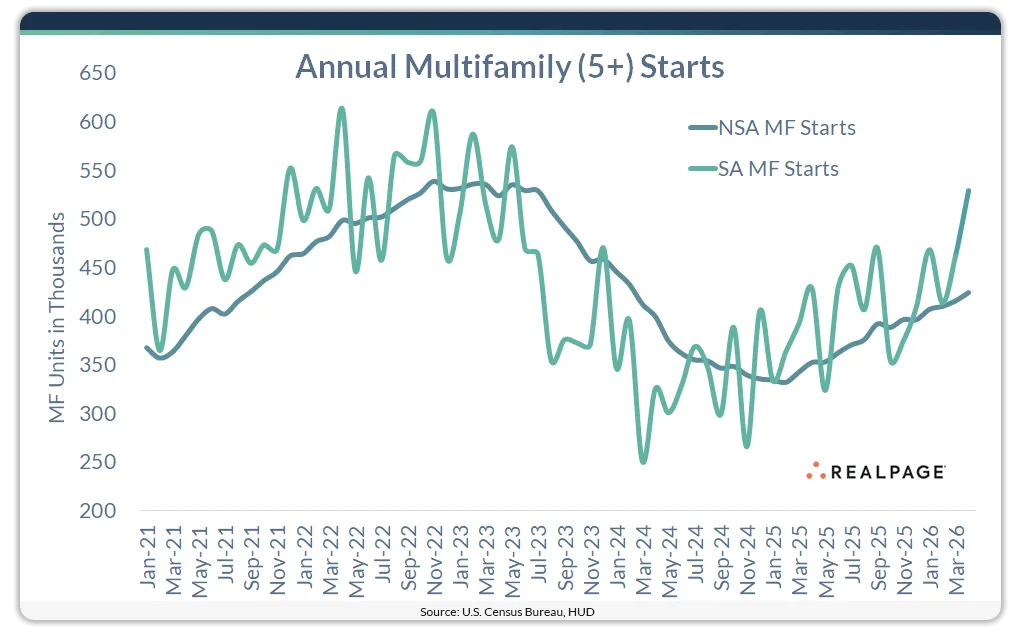
RealPage Senior Real Estate Economist Chuck Ehmann noted that headline SAAR figures can exaggerate month-to-month swings because they rely on seasonally adjusted survey estimates. A smoother picture emerges from the 12-month moving sum of non-seasonally adjusted data, which showed multifamily starts totaling 424,600 units through April, up 20.3% annually and 2% from March.
That gap matters. The adjusted annualized figure of 529,000 units sits nearly 20% above the rolling annual total, illustrating how volatile monthly construction data can become. Still, economists often view SAAR data as an early signal for directional shifts because it tends to identify turning points faster than trailing annual averages.
The adjusted starts series likely bottomed in March 2024, while the non-adjusted annual series did not trough until February 2025. That suggests multifamily construction may have already entered a gradual recovery phase months ago.
Permit Activity Points To Broader Recovery
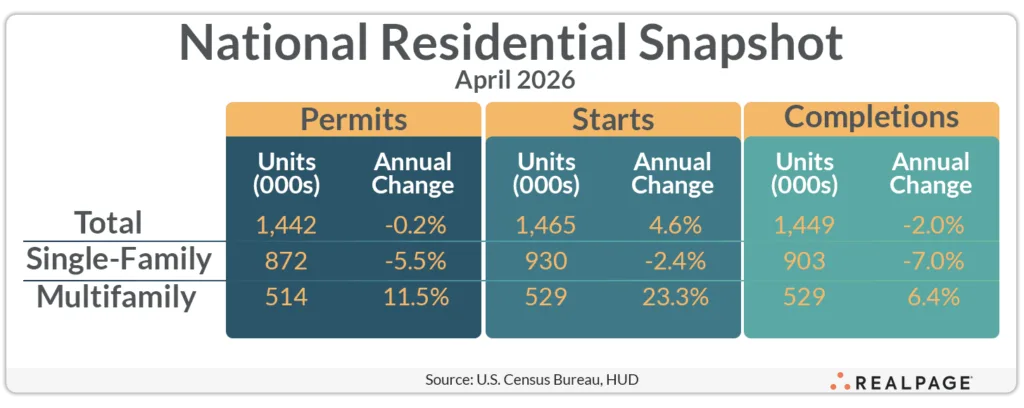
Multifamily permitting also moved higher in April, reinforcing the rebound narrative. Annualized multifamily permits increased 22.7% from March and 11.5% year over year to 514,000 units, per Census Bureau and HUD data.
On a non-seasonally adjusted basis, annual multifamily permits totaled 480,000 units, up 10.7% from April 2025. Regional trends showed especially strong gains in the Midwest, where multifamily permitting surged 64.1% annually to 103,000 units. The Northeast followed with a 30.4% increase to 74,000 units, while the South posted a more modest 5.3% rise to 224,000 units.
The West was the lone weak spot. Multifamily permitting there fell 12.2% year over year to 113,000 units, reflecting continued affordability pressures and slower deal activity in several coastal markets.
Starts data by region painted a similarly uneven picture. The West posted the sharpest annual gain, with multifamily starts jumping 192.8% to 163,000 units, while the Northeast rose 22.2% to 127,000 units. The South, long the nation’s apartment development engine, saw starts decline 14.7% to 174,000 units.
Single-Family Housing Remains Sluggish
While multifamily construction regained momentum, single-family housing activity continued to drift sideways. Annualized single-family starts fell 9% from March and 2.4% year over year to 930,000 units.
Single-family permitting declined 5.5% annually to 872,000 units, according to the April 2026 housing report. Builders continue to face affordability challenges tied to elevated mortgage rates, higher labor costs, and ongoing economic uncertainty.
Completions data reflected a similar divide between housing sectors. Multifamily completions rose 6.4% annually and 16.5% monthly to 529,000 units, while single-family completions dropped 7% from a year earlier to 903,000 units.
Pipeline Pressures Ease
Even with starts improving, the overall multifamily construction pipeline continues to shrink from historic highs. Multifamily units under construction declined 9.8% year over year to 670,000 units in April, though the figure ticked up slightly from March.
That decline reflects the industry’s broader recalibration after the record development cycle of 2021 through 2023. Many projects that broke ground during the low-rate era are now delivering into softer leasing conditions, particularly in high-supply Sun Belt metros.
Still, the recent increase in starts and permits suggests developers are selectively re-entering the market as construction costs stabilize and capital markets slowly reopen.
Why It Matters
The April construction data points to a multifamily sector that is shifting from contraction toward measured recovery. Developers are also balancing higher material costs and tariff uncertainty as new projects move through planning pipelines.
According to RealPage, multifamily starts likely bottomed earlier than expected. That shift suggests developers are positioning for the next leasing cycle.
What’s Next
The next few quarters will show whether April’s gains mark the beginning of a sustained rebound or a temporary bounce driven by volatile monthly data. Investors and developers will be watching financing conditions, construction costs, and rent growth trends closely, especially in oversupplied Sun Belt metros.
If mortgage rates remain elevated, multifamily could continue outperforming single-family construction as affordability pressures push more households toward renting. At the same time, a declining under-construction pipeline could help restore apartment pricing power in 2027 as new supply moderates.