


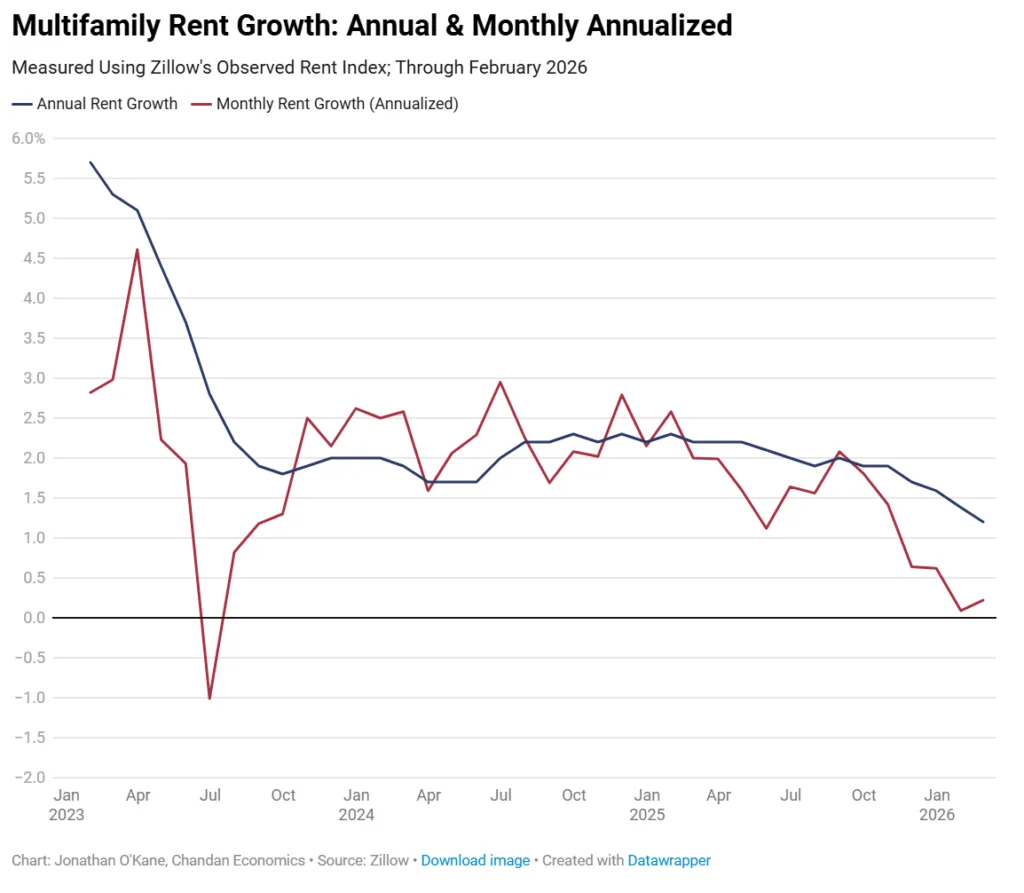
- National multifamily rent growth slowed to 1.2% year-over-year in February 2026.
- Monthly rent increases persisted but at a sharply reduced pace, annualizing at 0.2%.
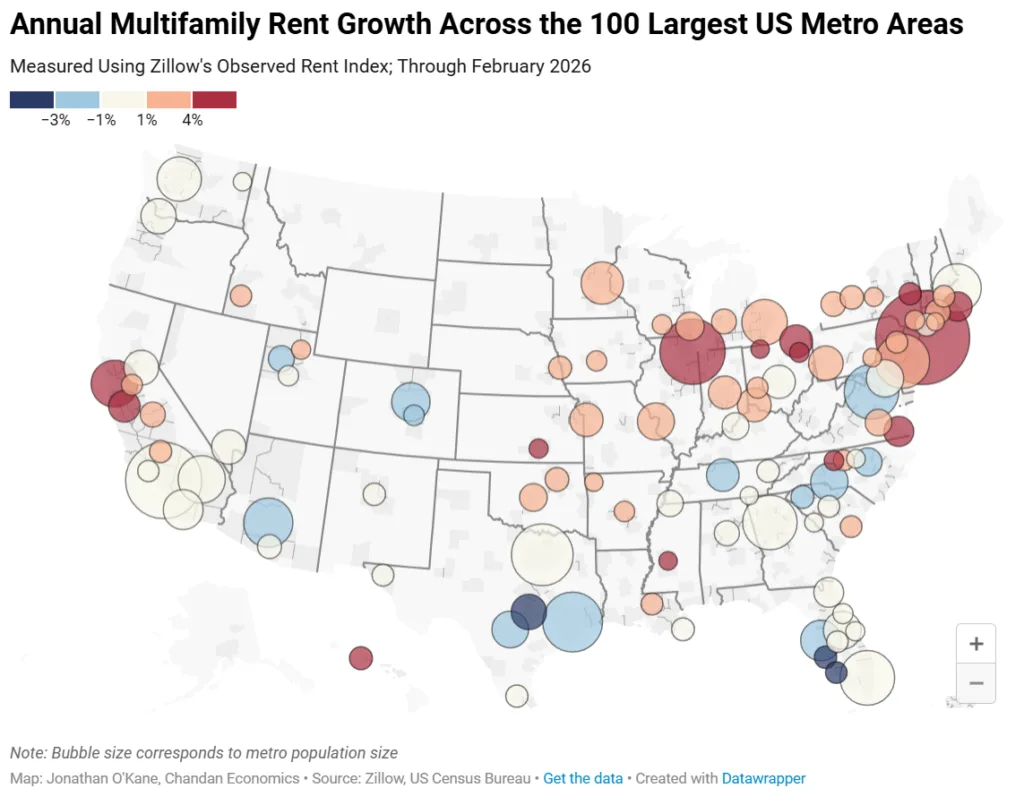
- Metros in Florida and Texas saw continued weakness, while Midwest and select coastal cities held firmer.
- Supply pipelines are rebalancing, supporting stabilization in multifamily rent growth conditions.
Steady Deceleration Continues
Multifamily rent growth across the US continued to decelerate in February 2026, according to the latest Zillow Observed Rent Index (ZORI) analysis. National rents rose 1.2% year-over-year, slowing from 1.4% in January and extending the downward trend seen since late 2024. Chandan Economics reports that while rents have now increased for 32 straight months, recent gains have become much more modest, with an annualized monthly growth rate of just 0.2%.
Weaker Momentum, Narrower Growth
The share of metros with monthly rent gains slipped to 64.8% in February, down slightly from January and well under the broader growth seen earlier in the recovery. Simultaneously, 86.6% of metros posted positive year-over-year growth, a slight uptick month-on-month but still well below the near-universal gains notched in 2021 and early 2022. The data suggest the multifamily sector has avoided large-scale contraction, but now sits in a period of minimal, localized growth.
Regional Performance Split
Geographic differences remain pronounced in multifamily rent growth. Florida and Texas are underperforming, weighed down by elevated supply and weaker absorption, with metros such as North Port and Cape Coral showing annual declines of -5.3% and -5.0%, respectively. This softness in Sun Belt markets comes even as broader commercial activity has picked up in recent months, with transaction volumes rebounding across several property types. Conversely, markets like Virginia Beach (+5.9%), San Francisco (+5.9%), and Chicago (+5.4%) continue to post solid annual growth.
What’s Next
Even though momentum is subdued, several indicators now point toward stabilization for multifamily rent growth. Absorption is recovering from recent lows and multifamily supply pipelines are tightening, thanks to fewer new project deliveries expected through year-end. A more balanced supply-demand equation is supportive of a gradual improvement in rent trends, particularly if absorption continues to recover in coming months.
Get Smarter about what matters in CRE
Stay ahead of trends in commercial real estate with CRE Daily – the free newsletter delivering everything you need to start your day in just 5-minutes