






- US industrial vacancy has plateaued at 7.3% in Q2 2026, reflecting a sharp pullback from the surge seen early this cycle.
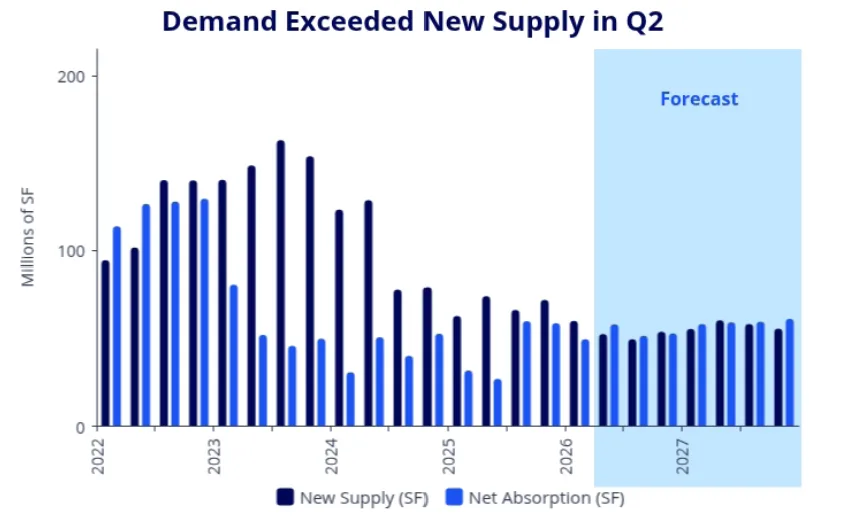
- Net absorption hit 59M SF in Q2, more than doubling new supply and signaling renewed occupier demand for space.
- Rents have stabilized at $10.34/SF nationally, ending the post-pandemic rent surge and suggesting a period of equilibrium ahead.
Demand Catches Up After Supply Glut
After two years of rising vacancy, the US industrial market is finding its footing again. According to Colliers, industrial vacancy dipped 7 basis points in Q2 2026 to 7.3%, marking the first real evidence that supply-demand fundamentals are back in balance. That’s just 4 bps higher than a year ago and well off the highest vacancy rates seen earlier in the cycle. Across the 79 markets Colliers tracks, 63% saw vacancies decline or flatten over the past year, led by sharp drops in Indianapolis, Charleston, Columbus, and Phoenix.
Vacancy rates remain above the 15-year average (6.2%), but the tide is turning as the construction boom slows and pre-leasing improves. With the pace of new deliveries reverting to historical norms after record output from 2022–2024, tenants are working through the surplus and active leasing is stabilizing key regions.
Get Smarter about what matters in CRE
Stay ahead of trends in commercial real estate with CRE Daily – the free newsletter delivering everything you need to start your day in just 5-minutes
Source: Colliers
The Details
National net absorption recorded in Q2 reached 59M SF, more than double the 27M SF absorbed in Q2 2025 and up 17% from the previous quarter. The South led the charge, accounting for half the nation’s absorption figure with Houston (7.6M SF), Dallas-Fort Worth (4.7M SF), and Atlanta (4.5M SF) posting standout quarters.
That rebound mirrors broader signs that occupiers are returning as developers pull back on new deliveries and fresh supply tightens nationwide. Importantly, net absorption outpaced new supply at 53M SF, the lowest quarterly total since 2016. That marks a stark reversal from the 2022–2024 period, when quarterly deliveries topped 100M SF for nine straight quarters. Among the 32 markets with YOY vacancy declines, Indianapolis saw the largest improvement, dropping 449 bps.
Construction Pipeline Rebounds Across the Midwest
Despite a moderation in deliveries, the overall construction pipeline remains robust. Colliers reports 312M SF under construction nationwide as of Q2, up 7% from the prior quarter and the highest point since late 2024.
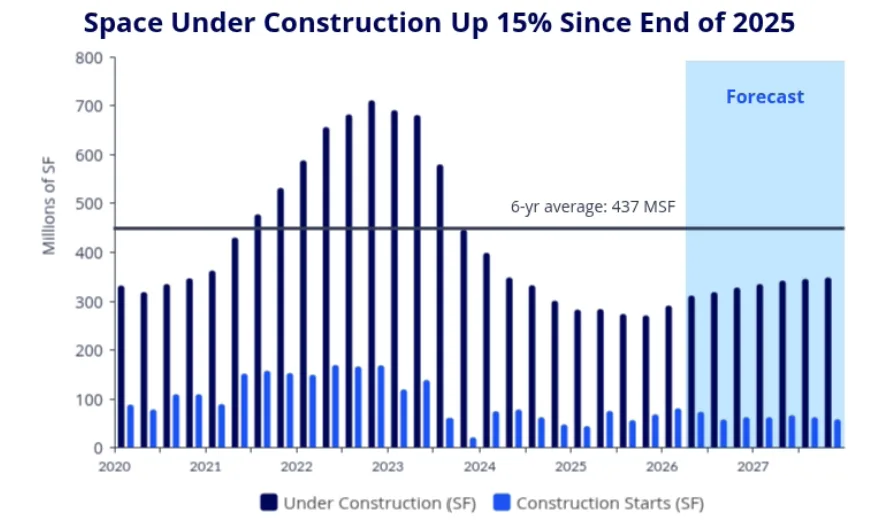
Most of that new activity is concentrated in the Midwest, where the pipeline jumped 34% to 66M SF—driven by surges in Chicago (up 45% YOY), Columbus (76%), Minneapolis-St. Paul (134%), and Indianapolis (70%). In contrast, the West region saw an 8% YOY decline. The construction surge reflects a mix of built-to-suit and spec projects 200,000 SF and larger. Nationally, Dallas-Fort Worth (36.3M SF, +21%), Houston (26.1M SF, +49%), and Atlanta (18.5M SF, +45%) top the metros for SF under construction.
Why It Matters
The stabilization of industrial vacancy at 7.3% signals that the market may be absorbing the unprecedented surge in new supply that stacked up as occupiers and developers capitalized on post-pandemic demand. According to Colliers, Q2’s 59M SF of net absorption outpacing 53M SF of new supply indicates tenants are back in the market, which could put a floor under vacancies heading into 2027. The rapid correction in key Sun Belt and Midwest markets, combined with slowing deliveries, suggests demand is increasingly chasing quality space, especially in logistics hubs.
On the rent front, the era of double-digit annual growth has ended. Warehouse/distribution asking rents averaged $10.34/SF nationally in Q2 2026, down 1.6% YOY—mainly reflecting corrections in coastal markets that spiked during the pandemic. Inland Empire, New York City, and the Bay Area continue to command premium pricing ($13–$17/SF), but most inland and Sun Belt markets are seeing stability or only modest increases. With supply pipelines recalibrating and leasing momentum building, rents are expected to maintain this plateau, barring any macro demand shocks.
What’s Next
The US industrial sector will watch for continued occupancy gains through the latter half of 2026 as restrained deliveries meet rebounding demand. While 312M SF remains under construction, fresh starts are picking up in select markets, signalling long-term confidence from both developers and occupiers.
Rent stabilization is likely to persist, especially given the tapering of pandemic-era booms and improving vacancy rates. Markets to watch: Midwest logistics corridors, where construction is accelerating, and select coastal regions recalibrating after years of outsized growth.