



- The 25 largest US industrial markets are splitting into tightening, stabilizing, and oversupplied camps, per Colliers.
- Markets like Phoenix, Indianapolis, and Houston led post-2020 inventory growth, while supply pipelines are contracting nationally.
- Demand-driven Midwest and Sun Belt metros are pulling ahead, pointing to early signs of a new expansion cycle for industrial real estate.
Entering the Next Cycle After Record Supply
The US industrial sector’s 25 largest markets are beginning to chart noticeably different courses as the frenetic supply wave of recent years ebbs. Colliers reports that these markets, which collectively expanded their inventories by nearly 1.9B SF (15%) since 2020, are now at various stages: some are tightening, others are stabilizing, and a few still face excess space. Pipeline resets and stabilizing demand signal the early stages of a new expansion, with fundamentals improving quickest in Midwest and Sun Belt regions. Coastal markets, by contrast, are still digesting the prior delivery surge.
This reset comes after the most aggressive industrial development boom the sector has seen. Vacancy growth is slowing as developers pause and occupier demand rebounds. Markets with discipline in new supply are leading the recovery, while those that overbuilt are lagging. The sector appears to be moving out of correction and into early expansion, with select regions clearly pulling ahead.
Get Smarter about what matters in CRE
Stay ahead of trends in commercial real estate with CRE Daily – the free newsletter delivering everything you need to start your day in just 5-minutes
Midwest and Sun Belt Take the Lead
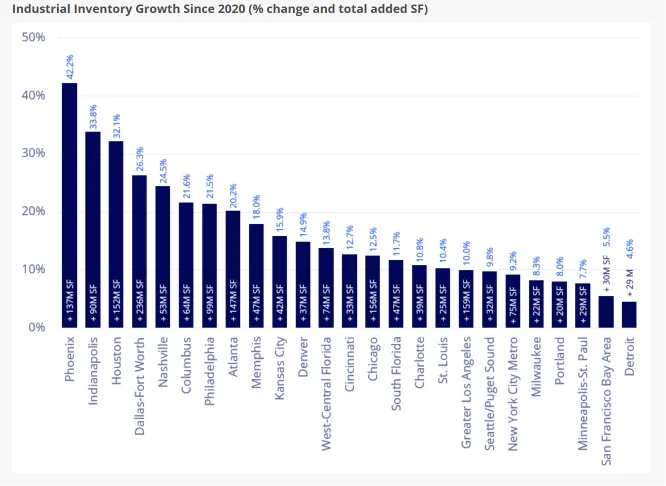
Phoenix, Indianapolis, and Houston stand out for the fastest industrial inventory growth since 2020. Phoenix expanded by 42% (adding 137M SF), Indianapolis by 34% (90M SF), and Houston by 32% (152M SF). Eight of the largest 25 markets saw inventories swell more than 20%.
Source: Colliers
However, the pace peaked in 2023, and the most recent year saw just 1.3% average growth across the top 25. As of Q1 2026, the national construction pipeline—after bottoming at 268M SF at 2025 year-end—ticked up to 286M SF, still well below the 2022 peak of 711M SF. Developers are re-entering some markets selectively as fundamentals turn positive.
Tightening Versus Saturation: A Market Split
Net absorption now outpaces new supply in 16 of the top 25 markets, indicating stabilized or tightening fundamentals. Six metros are in clear tightening: Columbus posted 11.1M SF in net absorption versus just 2.1M SF of completions, while Indianapolis clocked 15.7M SF absorbed—quadruple its 3.9M SF of new supply. Phoenix, Memphis, Cincinnati, and Chicago also saw demand outstrip additions.
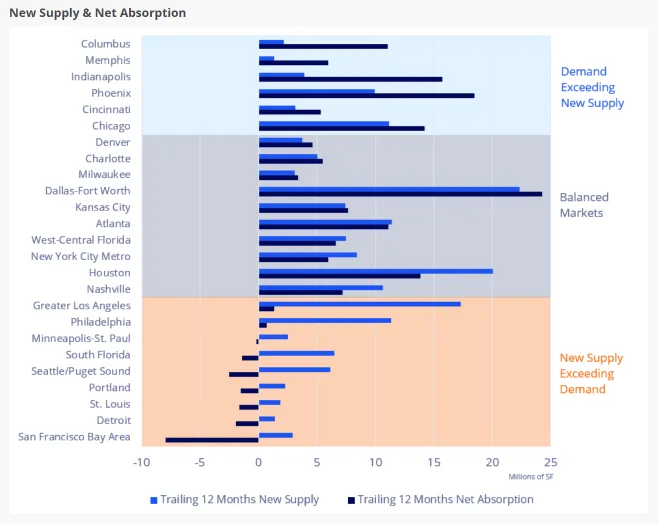
Meanwhile, coastal hubs like Greater Los Angeles delivered 17.4M SF but absorbed just 1.3M SF, still grappling with excess space. A similar divide has emerged in apartments, where some metros still struggle with elevated supply levels. But the number of supply-heavy markets is shrinking, a sign that equilibrium is near for much of the sector. Midwest metros and Sun Belt cities are best positioned as demand remains healthy and pipelines are right-sized.
Source: Colliers
Why It Matters
The divided recovery across America’s industrial hubs signals a new cycle for the sector. Colliers’ data suggests that selective market exposure is now key. The top 25 markets accounted for 189M SF (66%) of all US space under construction in Q1 2026, but only 12 posted net absorption greater than active pipeline—especially Indianapolis (15.7M SF absorbed vs. 4.1M SF under construction) and Phoenix (18.5M SF absorbed vs. 14M SF pipeline). Markets that overbuilt, notably Greater LA, Philadelphia, and Seattle, are still working through their supply, but retrenching construction is closing the excess.
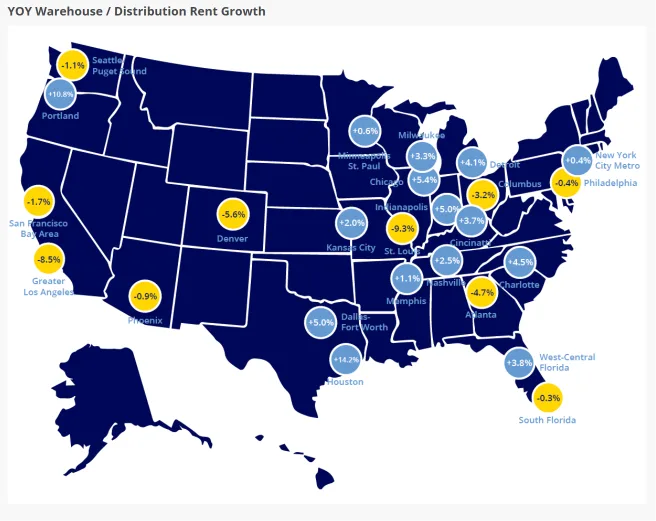
Rents reflect these diverging conditions. The average for the largest US industrial markets rose 0.8% to $9.72 PSF NNN in the last year, outpacing the national decline of 0.5%. Sun Belt and Midwest metros again excel, with Houston (+14.2%) showing the strongest growth, followed by Indianapolis (+5.4%), Dallas-Fort Worth (+5.0%), and Nashville (+5.0%). By contrast, rents dropped sharply in coastal, high-supply cities—Greater LA slipped 8.5%, Denver 5.6%, and Atlanta 4.7%. For developers and investors, these figures reinforce the need to focus capital where demand is real and growing, rather than chasing the last cycle’s hot spots.
Source: Colliers
What’s Next
With industrial construction pipelines 60% below their 2022 mark, the focus is shifting from delivery absorption to early-stage growth. Markets like Dallas-Fort Worth, Houston, and Indianapolis—notably with strong tenant demand and moderate pipelines—are set to attract a larger share of investment and development through 2026. Coastal markets are expected to remain slower-growing as they finish absorbing surplus space, but the segment as a whole is moving toward a broadly healthier equilibrium. Fundamentals, led by the Midwest and Sun Belt, support the thesis that the next industrial bull run is beginning. Investors, developers, and occupiers will need to watch these leading markets for the earliest signs of the next upcycle.