





- Self-storage CMBS delinquency remains at 0.05%, showing strong payment performance despite rising surveillance concerns.
- Nearly 30% of outstanding self-storage CMBS balances sit on watchlists, with risk concentrated in 2021-2024 loan vintages.
- Market-level supply growth and slower housing activity could shape the sector’s next phase of credit performance.
Self-storage CMBS continues to rank among commercial real estate’s stronger credit sectors, but surveillance data shows growing pressure beneath the surface. Delinquency remains extremely low at 0.05%, yet nearly 30% of outstanding balances are now flagged on watchlists.
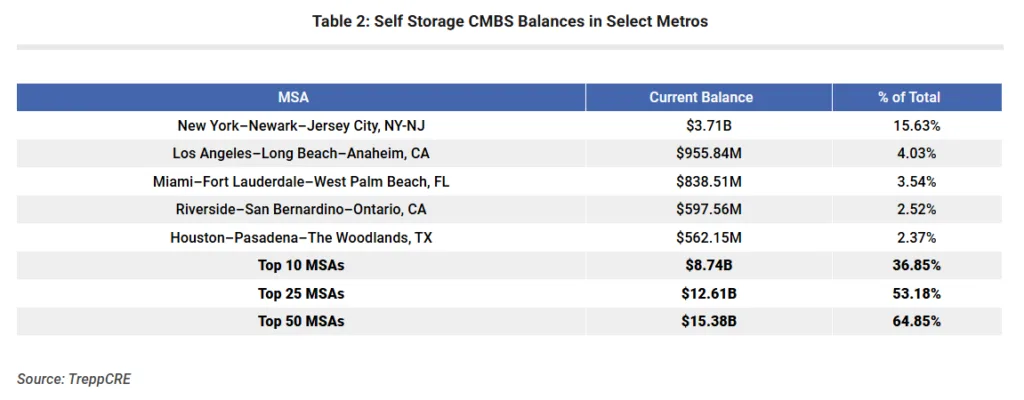
According to Trepp data, the sector includes approximately $23.7B in current CMBS exposure across about 4,800 loans and 15,600 properties. The gap between clean payment performance and rising watchlist activity suggests lenders are identifying potential issues before they become defaults.
Get Smarter about what matters in CRE
Stay ahead of trends in commercial real estate with CRE Daily – the free newsletter delivering everything you need to start your day in just 5-minutes
Peak-Valuation Loans Drive Watchlist Growth
The largest risks are concentrated in newer self-storage CMBS vintages issued during the market’s strongest valuation period. Loans originated between 2021 and 2024 were often priced with lower cap rates and stronger operating assumptions.
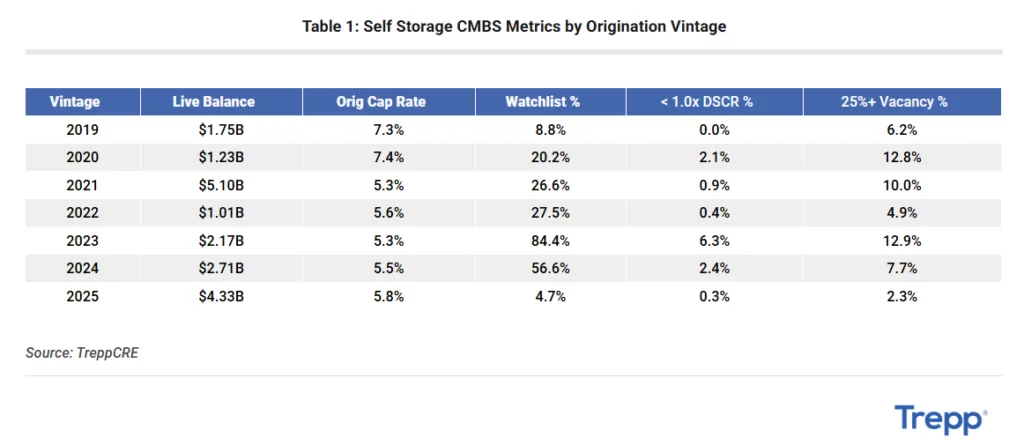
Trepp data shows the 2023 vintage has an 84.4% watchlist share, while 2024 loans carry a 56.6% watchlist rate. The 2021 vintage has a lower 26.6% share but represents a larger $5.1B balance. These loans face more pressure from softer demand, lower valuations, and higher refinancing costs.
Older vintages have avoided similar stress. The difference highlights that current concerns are tied less to the asset class itself and more to loans originated near the market peak.
The Details
Self-storage CMBS fundamentals remain relatively healthy despite rising surveillance activity. Only 0.84% of outstanding balances have debt service coverage ratios below 1.0x, indicating limited immediate payment strain.
The 2025 vintage represents another area to monitor. It carries approximately $4.3B in exposure but currently has only 4.7% of balances on watchlists. Because those loans are newer, they have had less time to experience operating pressure.
Watchlists are designed to identify loans facing challenges before missed payments occur. In this case, the data suggests servicers are seeing potential stress tied to underwriting assumptions rather than widespread borrower distress.
Geographic Concentration Adds Market Risk
Self-storage CMBS exposure is concentrated across several major metropolitan areas, making local market conditions an important factor in future performance.
New York currently remains one of the more stable markets, with roughly 16.7% of balances on watchlists. Other markets show greater pressure, including Atlanta at 50%, Chicago at 48%, and Miami at 39%.
The concentration creates both stability and risk. Strong performance in major markets can support sector-wide results, but weakness in a large exposure market could quickly affect broader CMBS metrics.
Supply Growth Challenges Sun Belt Markets
The self-storage market is facing a normalization period after rapid expansion during the 2021-2022 development cycle. Markets with heavy new construction pipelines are seeing more pressure on occupancy and pricing.
Trepp reports weighted-average occupancy across its self-storage exposure at 85.12%. However, market-level differences matter more than the overall figure. Phoenix, Tampa, and Las Vegas have experienced added pressure as new facilities compete for tenants.
The current environment appears more connected to supply imbalances than a broad demand collapse. Operators in high-growth markets are adjusting to increased competition after several years of strong development activity.
Housing Slowdown Weakens Demand Drivers
Self-storage demand has historically benefited from housing turnover. Moves, renovations, downsizing, and relocations typically create new customer demand for storage space.
Higher mortgage rates have slowed housing activity by keeping more owners in place. That reduces one of the sector’s key demand sources, particularly for new move-in customers.
Occupancy figures alone do not capture all market pressure. Chicago, for example, has 88.09% occupancy but a 48.4% watchlist share. Atlanta shows 85.49% occupancy with a 50.31% watchlist rate. Miami has 88.94% occupancy and a 38.79% watchlist share.
These differences show that current occupancy can mask weaker rent growth, absorption trends, and refinancing challenges.
Why It Matters
Self-storage CMBS is not showing signs of broad credit deterioration today. Payment performance remains strong, DSCR stress is limited, and occupancy remains relatively healthy.
The bigger signal is the widening gap between delinquency and watchlist activity. For investors and lenders, the watchlist provides an early indicator of where pressure may appear next.
The sector’s challenges are concentrated around specific loan vintages, development-heavy markets, and properties financed during peak valuation conditions. According to Trepp, these factors are creating a more selective credit environment rather than a sector-wide downturn.
What’s Next
Investors will likely continue monitoring newer loan vintages, refinancing conditions, and markets with elevated supply growth.
The 2025 vintage will be a key area to watch as loans gain seasoning and encounter a more normalized operating environment. Market performance will also depend on whether housing activity improves and whether operators can stabilize rents amid increased competition.
For now, self-storage CMBS remains a relatively resilient credit story. However, surveillance data suggests lenders are preparing for a more challenging cycle ahead.