



- San Francisco market rents grew 8.6% and Oakland 6.0% in the year ending Q2 2026, according to Altus Group’s same-store benchmark data.
- Three of seven consolidated submarkets, SoMa, Civic Center/Downtown and Haight Ashbury/Western Addition, account for 72.3% of the measured rent acceleration.
- Altus advises appraisers to stress-test rent growth and cap rates by submarket, since SoMa evidence is not interchangeable with the rest of the metro.
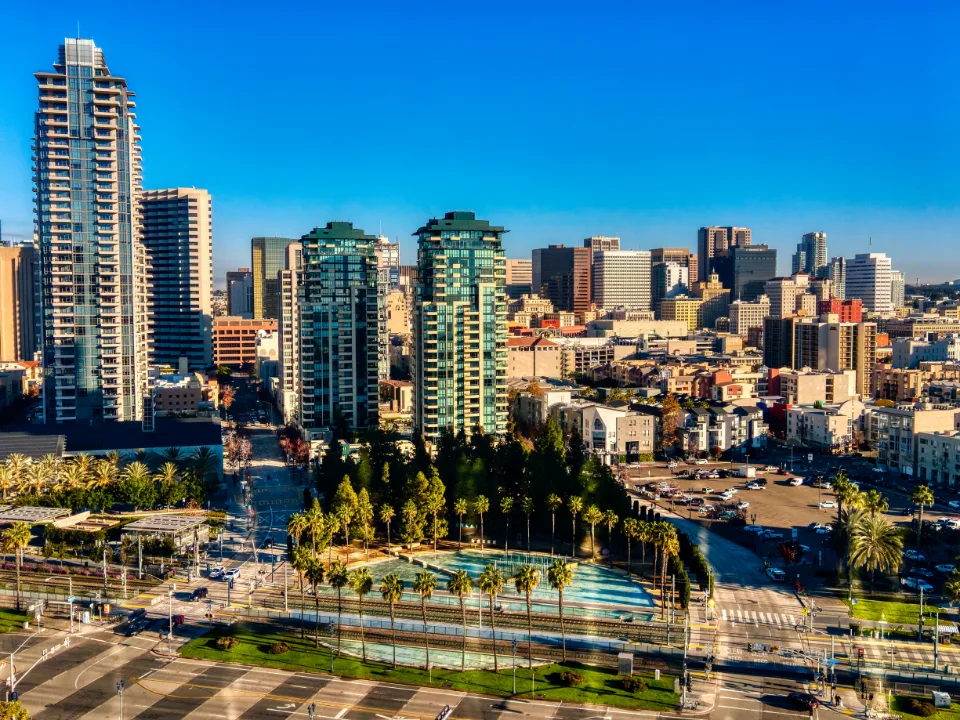
San Francisco’s multifamily recovery is real but narrow, according to Altus Group’s Chisem Phillips. Market rents grew 8.6% in San Francisco and 6.0% in Oakland in the year ending Q2 2026.
Phillips argues that a single metro-wide rent or cap rate assumption can mislead, because much of that strength sits in a few submarkets where tech hiring, proximity to AI employers and limited new supply overlap.
Get Smarter about what matters in CRE
Stay ahead of trends in commercial real estate with CRE Daily – the free newsletter delivering everything you need to start your day in just 5-minutes
A Volatile Cycle
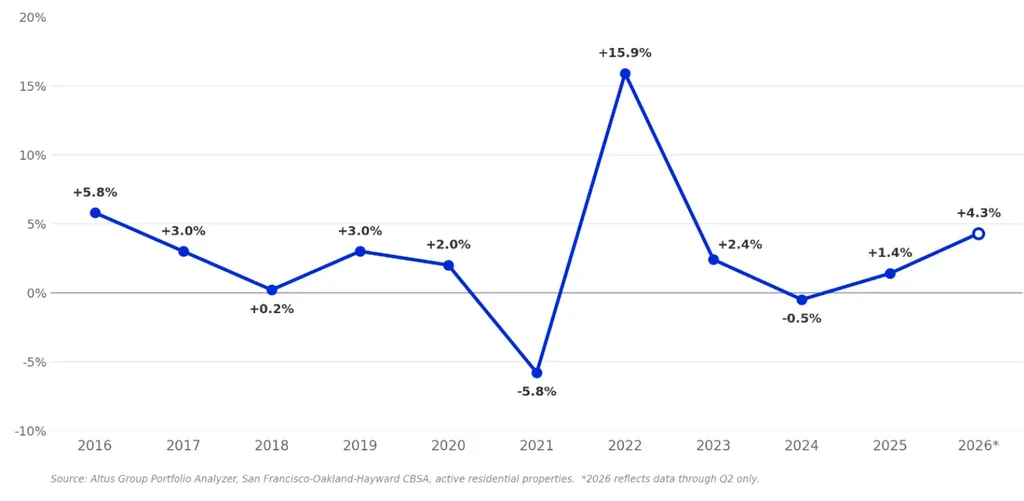
The Bay Area is coming off an unusually volatile post-pandemic stretch. Remote work and outmigration weakened office and multifamily demand, and market rents fell sharply in 2020 and 2021.
Rents recovered in 2022, grew into 2023 and cooled again in 2024. Employment, submarket location and new supply help explain why the latest recovery is so uneven.
A Narrow Tech Rebound
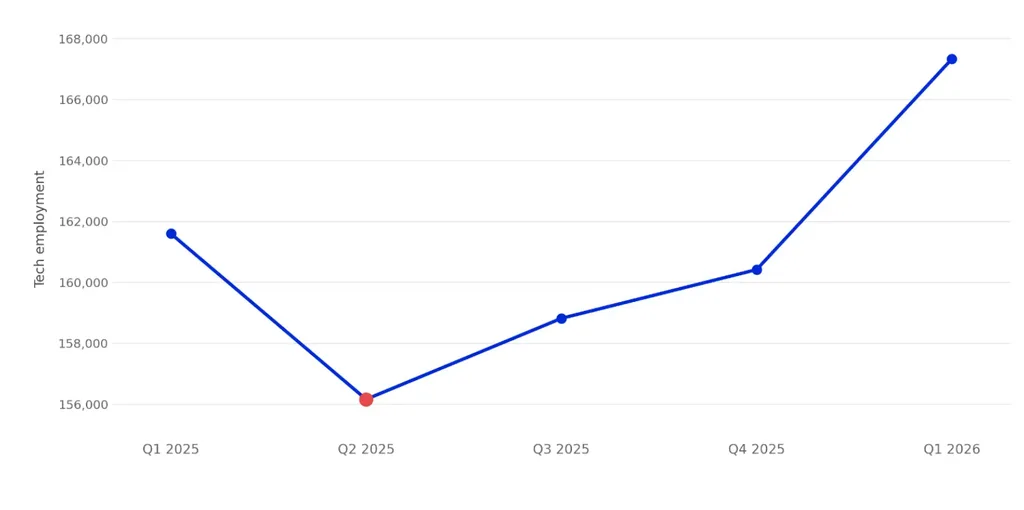
Tech employment peaked in 2023, even as large tech firms launched cost-cutting drives and laid off workers. It fell 8.8% in 2024 and 1.2% in 2025, per the Bureau of Labor Statistics.
It declined through Q2 2025 and then rose for three straight quarters, reaching 4.3% above the prior year by Q1 2026. The rebound is narrow: software publishers rose 12.7% and computing infrastructure providers 7.3% from Q1 2025 to Q1 2026, while computer systems design fell 13.6%.
That mix looks different from the broad technology expansion of the 2010s. Altus says it is more consistent with the software and infrastructure needs of the current AI cycle.
Three Submarkets Lead
Using Moody’s Analytics CRE data, Altus consolidated 17 submarkets into seven. The three strongest account for 72.3% of the measured rent acceleration on an unweighted basis.
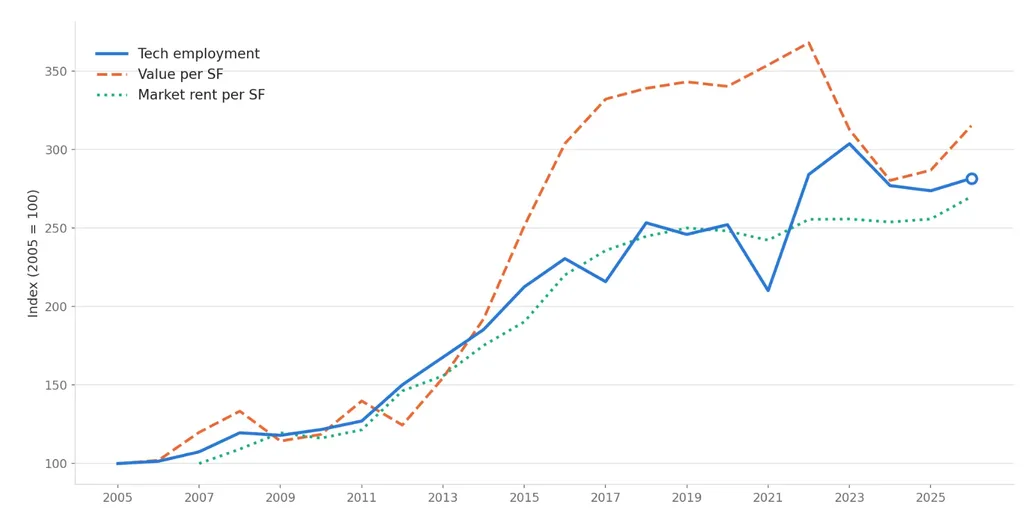
Those are South of Market, Civic Center/Downtown, and Haight Ashbury/Western Addition. Same-store data points the same way: submarkets with stronger rent growth generally posted stronger value gains, though not one for one, since expenses, cap rates and investor expectations also move value.
AI Employers Anchor SoMa
Anthropic’s headquarters at 500 Howard Street and OpenAI’s at 1455 Third Street both overlap with Altus assets in the SoMa grouping. That puts the strongest rent and value performance next to two major AI employment nodes.
In February 2026, Anthropic’s president said the company had more than 1,300 Bay Area employees as it leased all of 300 Howard Street. Altus calls the overlap suggestive of AI-related demand, but says limited new supply likely contributed.
Supply Explains the Gap
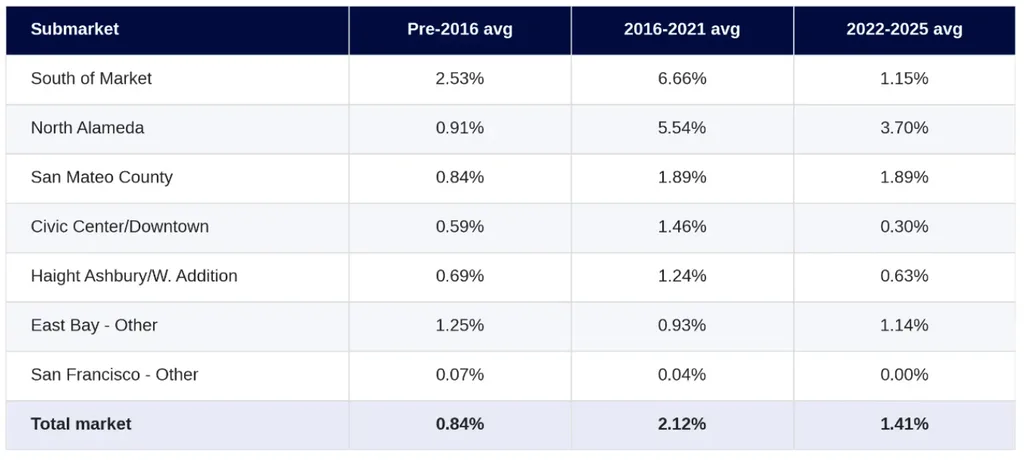
Construction helps explain the difference. SoMa’s average annual construction rate fell from 6.66% in 2016 to 2021 to 1.15% in 2022 to 2025.
Civic Center/Downtown also recorded limited deliveries. North Alameda is the contrast: its recent construction rate stays above its long-term average, and its rent and value growth has been weaker.
SoMa’s recent net absorption is small relative to reported headcount growth at nearby AI employers. Investors tracking AI-driven multifamily demand should weigh supply as closely as jobs.
Why It Matters
Altus recommends stress-testing rent growth and cap rate assumptions by submarket rather than relying on one metro-wide figure. Appraisers should not treat SoMa sales and leasing evidence as interchangeable with the rest of the metro, and should adjust comparables for submarket differences.
Altus notes that employee residence data is not available, so the analysis links employment, supply, rent and value at the submarket level, not the household level. At that level, concentrated hiring, tighter vacancy and limited supply explain the gains.
The warning applies beyond San Francisco. Rents across the country are moving unevenly, as the latest national rent data shows. In San Francisco, a small, supply-constrained group of submarkets is recovering faster while the broader metro grows more slowly.
What’s Next
The tech rebound has to broaden for rent gains to spread beyond the leading submarkets. Watch whether employment growth in software and infrastructure holds up and whether supply remains low in SoMa and other leaders.
Altus cites its Portfolio Analyzer, BLS data and Moody’s Analytics CRE as the basis for its findings.