



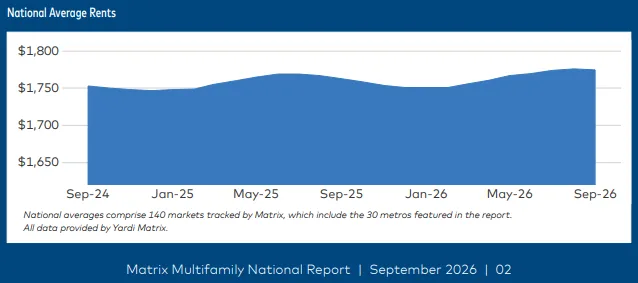
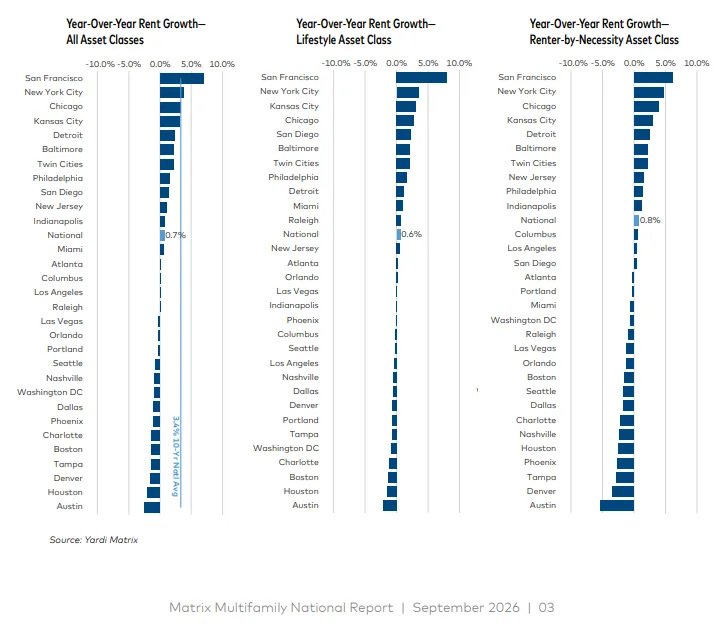
- Advertised rents fell $1 to $1,775 in September, yet annual growth rose 20 basis points to 0.7%, and rents gained 0.3% in the quarter, the first Q3 increase since 2022.
- Market performance is converging: excluding San Francisco, the spread between the second- and 30th-ranked markets narrowed to 6.3 percentage points from 8.4 in January.
- Q4 is the test, since rents have fallen $7 on average in that quarter over four years, while a 10-year Treasury yield above 5% weighs on transactions.
U.S. multifamily advertised rents slipped $1 in September to $1,775, but year-over-year growth improved by 20 basis points to 0.7%, according to Yardi Matrix’s September national report. Rents are up 1.4% year to date.
The third quarter produced a 0.3% gain, the first third-quarter increase since 2022.
Get Smarter about what matters in CRE
Stay ahead of trends in commercial real estate with CRE Daily – the free newsletter delivering everything you need to start your day in just 5-minutes
Markets Converge
Performance across markets is becoming less polarized. Excluding outlier San Francisco, the spread between the second- and 30th-ranked Matrix markets has narrowed to 6.3 percentage points from 8.4 in January.
Only two markets now post annual declines of 2% or more, compared with five in January. Average declines among negative markets have moderated to 1.1% from 1.8%.
By asset class, Lifestyle rents rose 0.6% year over year and Renter-by-Necessity rents rose 0.8%.
San Francisco Leads, Austin Trails
San Francisco led annual rent growth at 7.0%, followed by New York City at 3.8%, Chicago at 3.2%, Kansas City at 3.1% and Detroit at 2.3%. Gateway and Midwest markets set the pace.
Fourteen of the top 30 metros still recorded negative rent growth. Austin fell 2.5%, Houston 2.0%, Denver 1.6%, and Tampa and Boston both 1.4%.
Renewals Lose Steam
Renewal rent growth has slowed to 1.7% nationally, its lowest level since before the pandemic and well below an 8.7% peak in early 2023. Matrix says renewals had been a key source of revenue growth while advertised rents sat negative in many markets, but existing rents are now catching up.
Renewals remain strong in San Francisco at 8.2%. High-supply metros are weaker, with Austin at negative 4.3% and Phoenix at negative 2.4%.
Occupancy and Single-Family Rentals
The report now tracks total occupancy, which includes properties in lease-up, alongside stabilized occupancy. Total occupancy has risen 50 basis points since January, a sign that new units are being absorbed.
Single-family build-to-rent advertised rates fell $4 in September to $2,245, the first monthly decline since January, but are up 0.8% year over year. Single-family rental occupancy was 94.9% in August, down 20 basis points from a year earlier.
Why It Matters
Matrix says improving market breadth, slowing supply growth and resilient occupancy suggest multifamily is entering Q4 on firmer footing. Stable or improving occupancy in several high-supply markets points to gradual rebalancing.
The risk is financing. The 10-year Treasury yield has climbed well above 5%, raising refinancing costs and likely weighing on transactions, and the trend ties into the broader multifamily distress story.
What’s Next
The fourth quarter will be an important test. Rents have declined by an average of $7 in Q4 over the past four years, so if they hold near current levels through year-end, annual growth could finish above 1%.
Higher mortgage costs may also keep renters in place longer by making homeownership less attainable, though they may constrain household formation.