


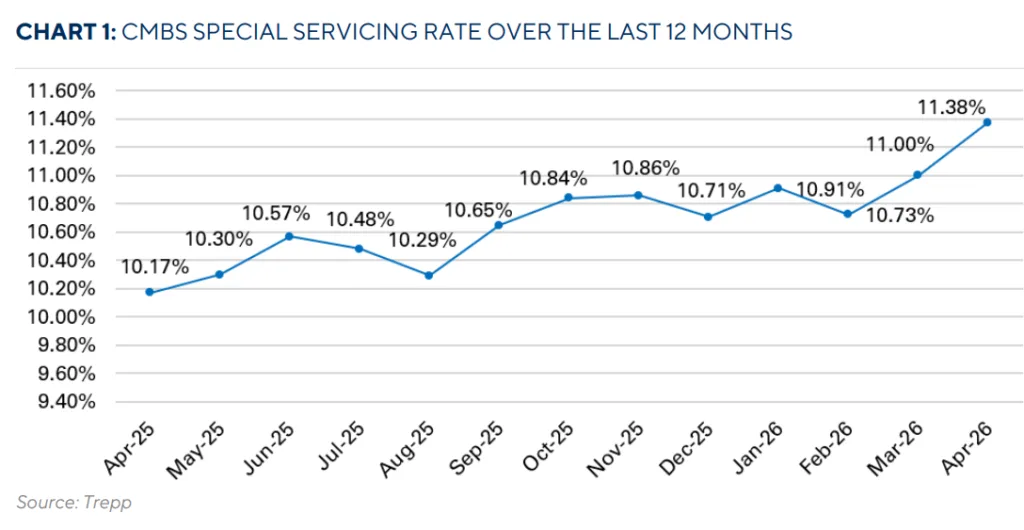
- The Trepp CMBS special servicing rate climbed 38 basis points to 11.38% in April 2026 as office loans dominated new transfers.
- Large urban office assets and maturing SASB loans accounted for much of the increase, including Houston’s Allen Center complex and the SOP2 office portfolio.
- The continued rise in office distress signals that refinancing pressure remains elevated even as some borrowers secure extensions and modifications.
Office distress continued to weigh on the CMBS market in April, pushing the overall special servicing rate to 11.38%, according to Trepp’s April 2026 CMBS Special Servicing Report. The increase marked a 38-basis-point jump from March and reflected a steady stream of office loans struggling with looming maturities and weak property cash flows.
The biggest driver was office exposure. Trepp reported that office special servicing rates climbed 93 basis points month over month to 17.66%, far above every other major property type. Multifamily also rose, though at a much smaller scale, while retail remained flat.
Get Smarter about what matters in CRE
Stay ahead of trends in commercial real estate with CRE Daily – the free newsletter delivering everything you need to start your day in just 5-minutes
An Office-Heavy Wave of Distress
New transfers to special servicing totaled roughly $1.93B across 43 loans in April, with office assets accounting for more than half of the total volume, according to Trepp. Large CBD office towers, suburban office portfolios, and several SASB loans made up the bulk of the activity as borrowers faced refinancing hurdles ahead of maturity dates.
The largest transfer was the $470M One & Three Allen Center loan in Houston. The loan failed to pay off by its fully extended maturity and transferred to special servicing for imminent balloon default. The collateral includes a 2.3M-square-foot downtown office complex originally built in 1972 and renovated in 2020.
The second-largest transfer involved the $175.2M SOP2 Portfolio loan, backed by suburban office properties across six states. The portfolio posted a debt service coverage ratio of just 0.76x and occupancy of 66.8% for full-year 2025, underscoring the operational pressure many suburban office owners continue to face.
The Details
Trepp’s report showed distress spreading across nearly every property type in April. Industrial special servicing rates rose to 1.23%, lodging increased to 9.66%, and multifamily climbed to 9.08%. Mixed-use assets edged up slightly to 12.21%, while retail held steady at 12.99%.
Despite the rise in transfers, several large loans also exited special servicing through extensions and negotiated workouts. Trepp identified approximately $847.1M in cures during April, led by the $439.2M Starwood Regional Mall Portfolio loan. The borrower secured a maturity extension through September 2026 while pursuing asset sales and an eventual exit strategy.
Another notable cure involved the $131M Millennium Corporate Park loan in Redmond, Washington. The suburban office campus returned to the master servicer after a modification extended the loan maturity to January 2029 in exchange for new borrower equity, enhanced cash management provisions, and a principal paydown.
A Widening Refinancing Divide
The latest data highlights a growing divide between property sectors still attracting lender interest and those facing refinancing gridlock. Industrial special servicing rates remain low despite a slight uptick, while office continues to absorb the majority of market stress.
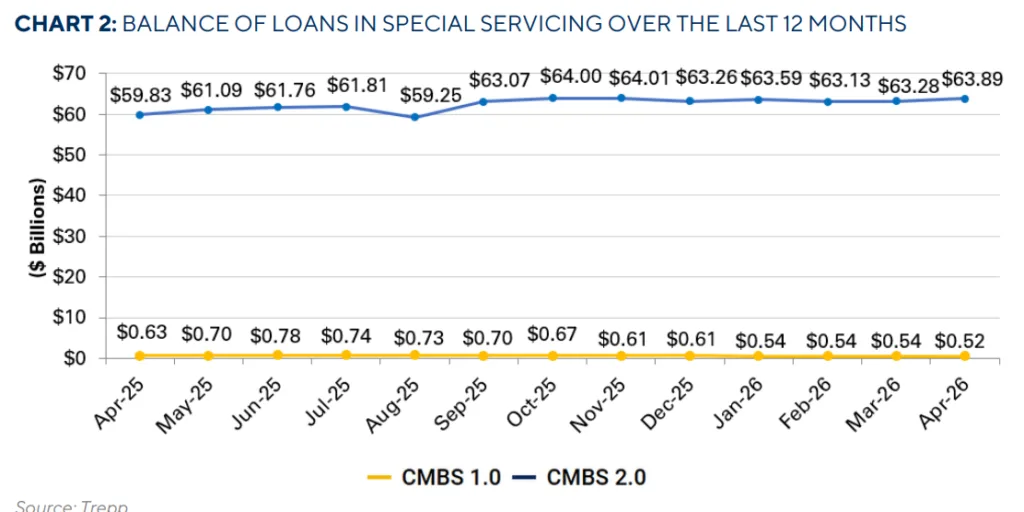
Trepp’s data also showed a stark difference between legacy CMBS 1.0 deals and post-financial-crisis CMBS 2.0+ transactions. CMBS 1.0 loans posted an overall special servicing rate of 61.29% in April, compared to 11.30% for CMBS 2.0+ deals. Retail distress was especially acute in older vintages, with CMBS 1.0 retail servicing rates exceeding 92%.
That gap reflects both structural underwriting differences and changing market fundamentals. Pre-2008 deals often carried higher leverage and weaker debt service protections, while newer transactions generally benefited from tighter underwriting standards implemented after the financial crisis.
Why It Matters
The April report underscores a persistent risk for CRE lenders and investors. Office maturities still pressure the broader market. Higher interest rates and lower valuations continue to block refinancing efforts. Weak leasing demand adds more pressure, especially for older downtown and suburban offices.
Meanwhile, lenders still avoid widespread liquidations. Many continue extending loans instead of forcing immediate resolutions. Many office loans transferred into special servicing this year also faced refinancing pressure tied to looming maturities and weak occupancy. That trend mirrors earlier servicing increases driven by mounting office distress across the CMBS market. These “extend and pretend” strategies give borrowers more time to improve occupancy. They also allow owners to wait for stronger capital markets.
Trepp’s April data suggests that trend could continue through 2026. Billions in office maturities still loom across the CMBS market.
What’s Next
Market participants will be watching whether office special servicing rates continue climbing through the second half of 2026 or begin to stabilize as more loans work through restructurings. Borrowers with near-term maturities remain under pressure, especially those with low occupancy or weak DSCR metrics.
Attention will also shift toward how special servicers handle large urban office assets facing valuation declines. If refinancing conditions remain tight, more borrowers may pursue discounted payoffs, note sales, or recapitalizations instead of traditional refinancings.
For now, Trepp’s April report points to a CMBS market still managing through the long tail of office disruption rather than emerging from it.