






- The second half of 2026 brings $37B in hard CMBS maturities, but the refinancing risk is concentrated in select loan structures and property types.
- Interest-only loans, office and mixed-use collateral, and New York MSA assets carry the largest gaps requiring significant new equity at maturity.
- Aggregate maturity statistics understate the challenge—over half of affected loans will need cash-in, spotlighting asset- and market-specific vulnerability.
Refinancing Pressure Is Not Uniform
According to Trepp’s mid-year CMBS analysis, reports that about $37B in private-label commercial mortgage-backed securities (CMBS) loans face unavoidable maturity in the second half of 2026. Though $65B in loans mature on paper, roughly $28B can be extended into 2027 or later, so true hard maturities are lower. But the aggregate math tells only part of the story. Trepp’s deep dive into 799 non-split, non-defeased, non-delinquent loans—totaling $15.1B—shows a substantial portion will hit a refinancing roadblock unless new equity is injected.
According to Trepp, 54% of these clean-sample loans would still require fresh capital to refinance at today’s interest rates and underwriting standards. The risk isn’t spread evenly, either. Pressure is highest in IO structures, office and mixed-use assets, and exposure-heavy markets like New York, underscoring market participants’ need to look beneath the headline numbers.
Get Smarter about what matters in CRE
Stay ahead of trends in commercial real estate with CRE Daily – the free newsletter delivering everything you need to start your day in just 5-minutes
Interest-Only Structures Dominate the Shortfall
The biggest divide approaching the 2026 maturity wall comes from loan payment structures. IO loans represent $8.2B of the $15.1B in ‘hard’ maturities. However, Trepp estimates these loans support only $6.8B in refinance proceeds. As a result, 80% of IO loans fall short. Additionally, 61% require at least 20% cash-in for a new loan.
Amortizing loans show a starkly different picture. Trepp projects $9.4B in refinance capacity for $6.9B of maturing amortizing loans. Only 23% require any cash-in, while just 9% need an equity contribution of 20% or more. These differences matter when assessing refinancing risk for 2H 2026. IO structures provide less support when property income cannot meet tighter underwriting standards.
Office, Mixed-Use, and New York Stand Out
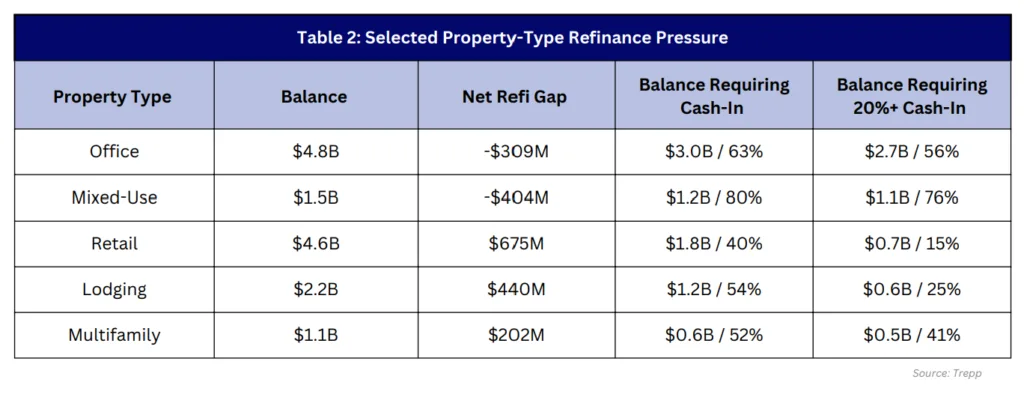
Property type and geography create further concentrations of refinancing risk. Office loans total $4.8B and face a $309M net refinance shortfall. About 63% require cash-in, while 56% need at least a 20% contribution. More than 75% of IO office balances require significant cash-in.
Mixed-use assets face an even sharper challenge. Of $1.5B in maturing mixed-use debt, 80% requires cash-in. Meanwhile, three-quarters need at least a 20% infusion. Retail, lodging, and multifamily perform better overall but still contain pockets of asset-level risk.
Geographically, Trepp identifies the Middle Atlantic, Pacific, and New York MSA as key pressure zones. New York represents almost 40% of loans requiring paydowns of 20% or more. The market faces a $627M net refinancing shortfall against $2.9B in maturing balances.
Why It Matters
The headline $37B CMBS maturity figure could lull the market into complacency. However, actual refinancing pressure remains far more concentrated. Trepp highlights particular challenges for IO structures, especially across office and mixed-use properties. That pressure follows office distress pushing the CMBS special servicing rate to 11.38%.
About $5.6B, or 37% of the sample, requires at least 20% equity or another maturity solution. That pressure could drive tougher negotiations, discounted payoffs, and defaults across New York, San Jose, and other high-exposure markets. Loans combining IO terms, troubled property types, and major MSAs face the greatest risk. Meanwhile, stronger retail, lodging, and industrial assets could maintain more resilient transaction activity.
The crucial threshold is 20% cash-in. Sponsors can often manage fresh equity contributions between 5% and 10%. However, larger paydowns demand greater liquidity and stronger conviction in asset fundamentals. Each outcome will depend on cash flow, modifications, borrower appetite, and lender flexibility.
What’s Next
If current market terms persist through 2H 2026, loans in higher-risk categories could face mounting pressure. Expect more workouts, creative modifications, and potentially greater transaction activity in cities with large refinancing gaps. Borrowers may pursue asset sales or other solutions as difficult maturities approach.
For investors and servicers, loan-level vigilance will matter more than comfort from aggregate numbers. Interest rate shifts or stronger cash flows could reduce eventual defaults. Still, equity-heavy solutions and targeted asset management will remain central to navigating maturity risk.