




- Office, retail, and industrial rents remain higher year over year, but their recent momentum is moving in different directions.
- Office rents rose 8.8% through July, while retail weakened recently and industrial growth moved toward a steadier pace.
- CompStak’s net effective rent data shows national averages are becoming less useful without market-level leasing and concession context.
Commercial property rents remain above year-ago levels, but sector momentum is separating, GlobeSt reported. Its coverage of the September rent index update shows office slowing, retail weakening, and industrial rents moving toward a steadier pace.
Get Smarter about what matters in CRE
Stay ahead of trends in commercial real estate with CRE Daily – the free newsletter delivering everything you need to start your day in just 5-minutes
The Details
CompStak’s Columbia CompStak Rent Index tracks constant-quality net effective rents rather than asking rents. The methodology adjusts for changes in space quality and incorporates concessions into the rent measure.
That distinction matters when free rent, tenant-improvement packages, and flight-to-quality leasing distort headline pricing. Owners and lenders therefore get a view closer to the economics being underwritten in actual leases.
Office Strength Is Losing Speed
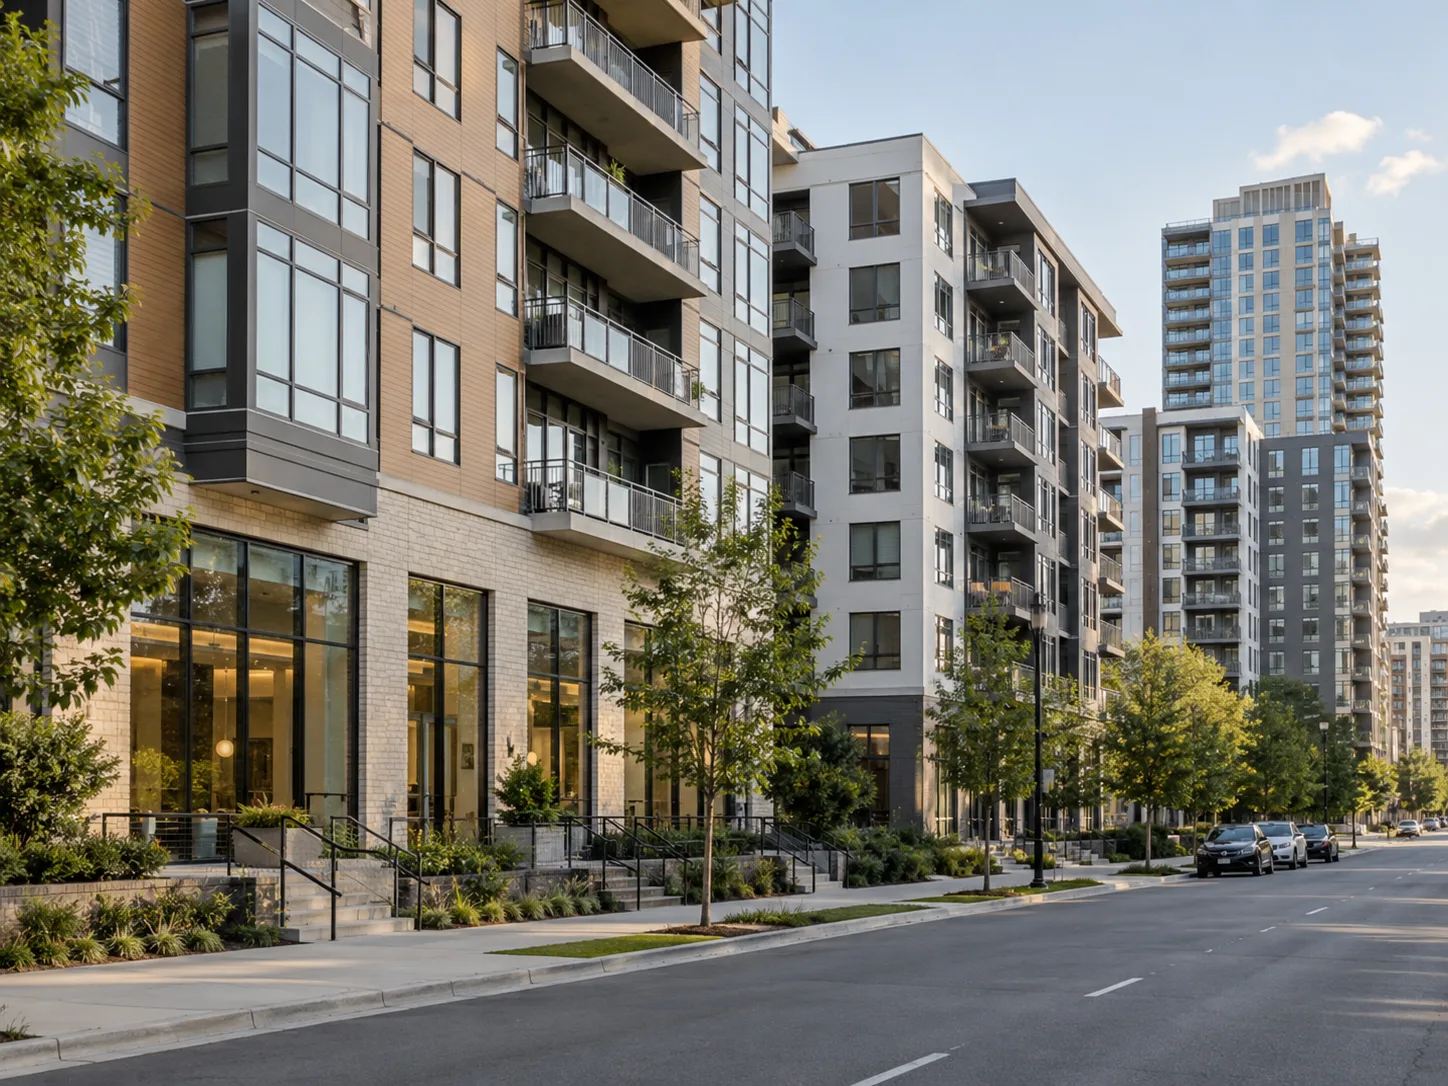
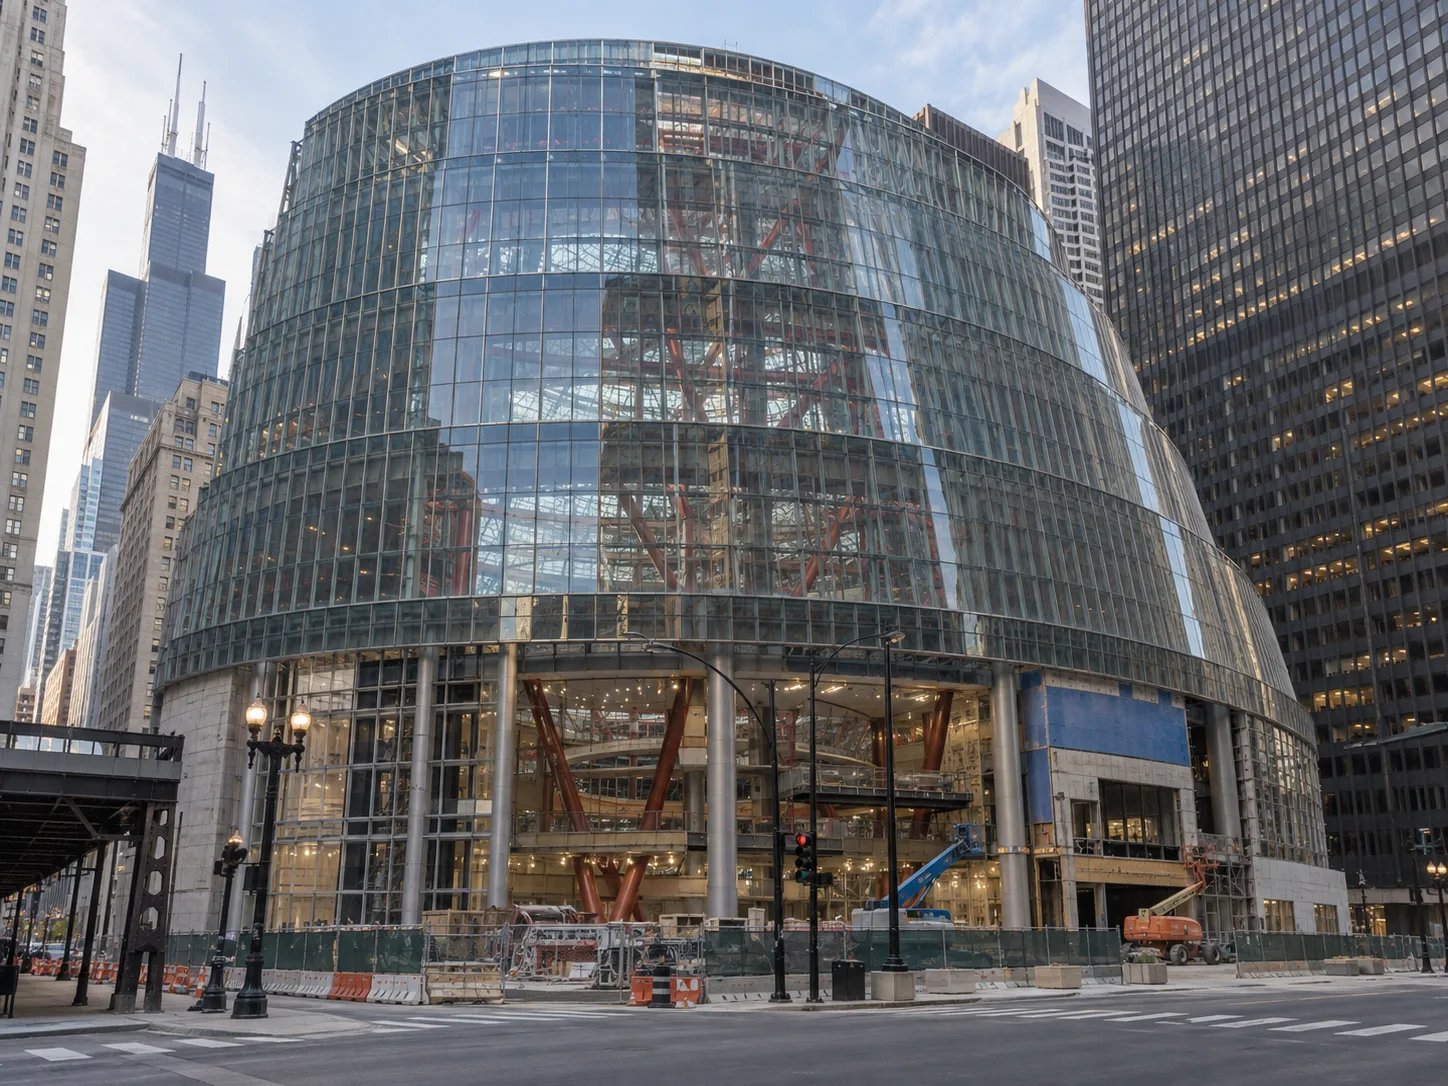
Office posted the strongest annual increase among the three sectors. CompStak reported constant-quality net effective rents up 8.8% in the year through July.
However, the more recent office trend has cooled. That means a strong trailing-year number can coexist with softer current leasing activity, especially after an earlier rebound.
CompStak classifies office markets above 6.22% annual growth as high tier and those below negative 0.62% as low tier. Of 39 office MSAs, 22 recorded positive trailing-year rent growth.
Fourteen office markets landed in the high-growth tier, 15 in the low tier, and 10 in the middle. San Francisco, Denver, and Cincinnati were among the low-growth markets.
Retail Momentum Turns Softer
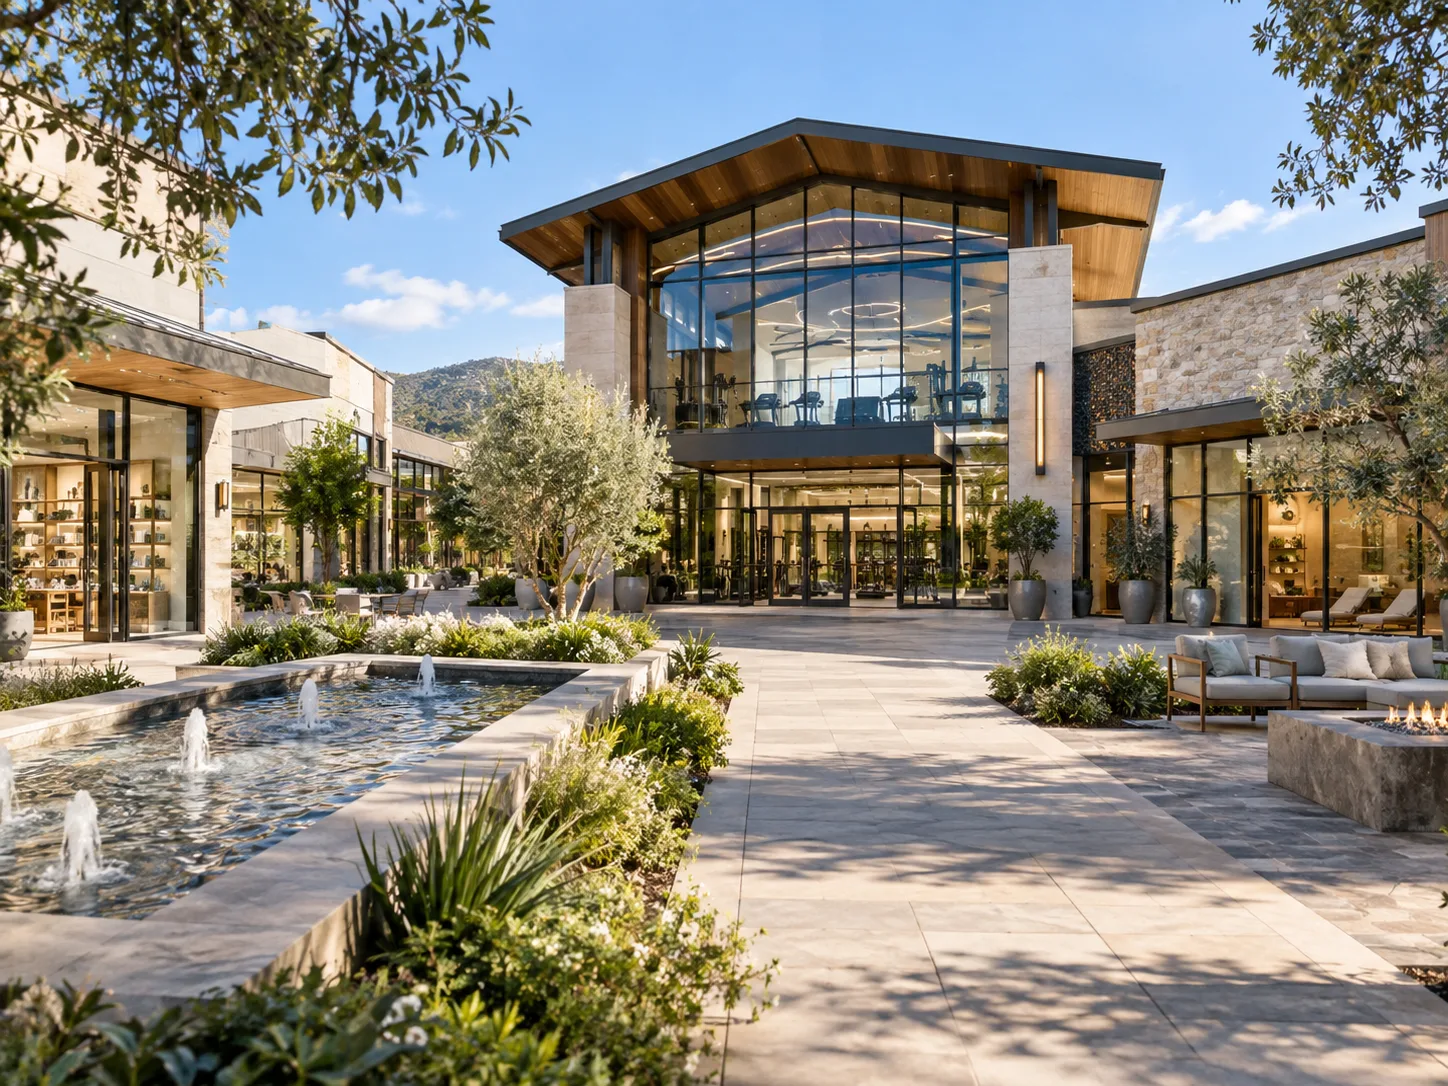
Retail shows the opposite pattern. Longer-term performance remains positive, but CompStak said rent declines accelerated over the latest one-, three-, and six-month periods.
The sector also carries more measurement noise across markets. Its middle quarter-over-quarter range spans a 6.14% decline to a 7.66% increase, a 13.8-point spread.
That compares with 5.51 points for office and 7.16 points for industrial. CompStak said thin market coverage explains part of the wider retail dispersion.
New York provides a deeper data point. The city recorded $407.5M of annual retail leasing volume and 2.6% trailing-year rent growth, placing it in the middle tier.
Eight retail MSAs cleared CompStak’s 10.59% high-growth threshold, including Boston, Detroit, Miami, Nashville, Riverside, San Antonio, San Francisco, and San Jose.
Nine markets fell below the sector’s negative 4.88% low-growth threshold. The wide spread reinforces how little a single national retail average says about local leasing conditions.
Industrial Growth Normalizes
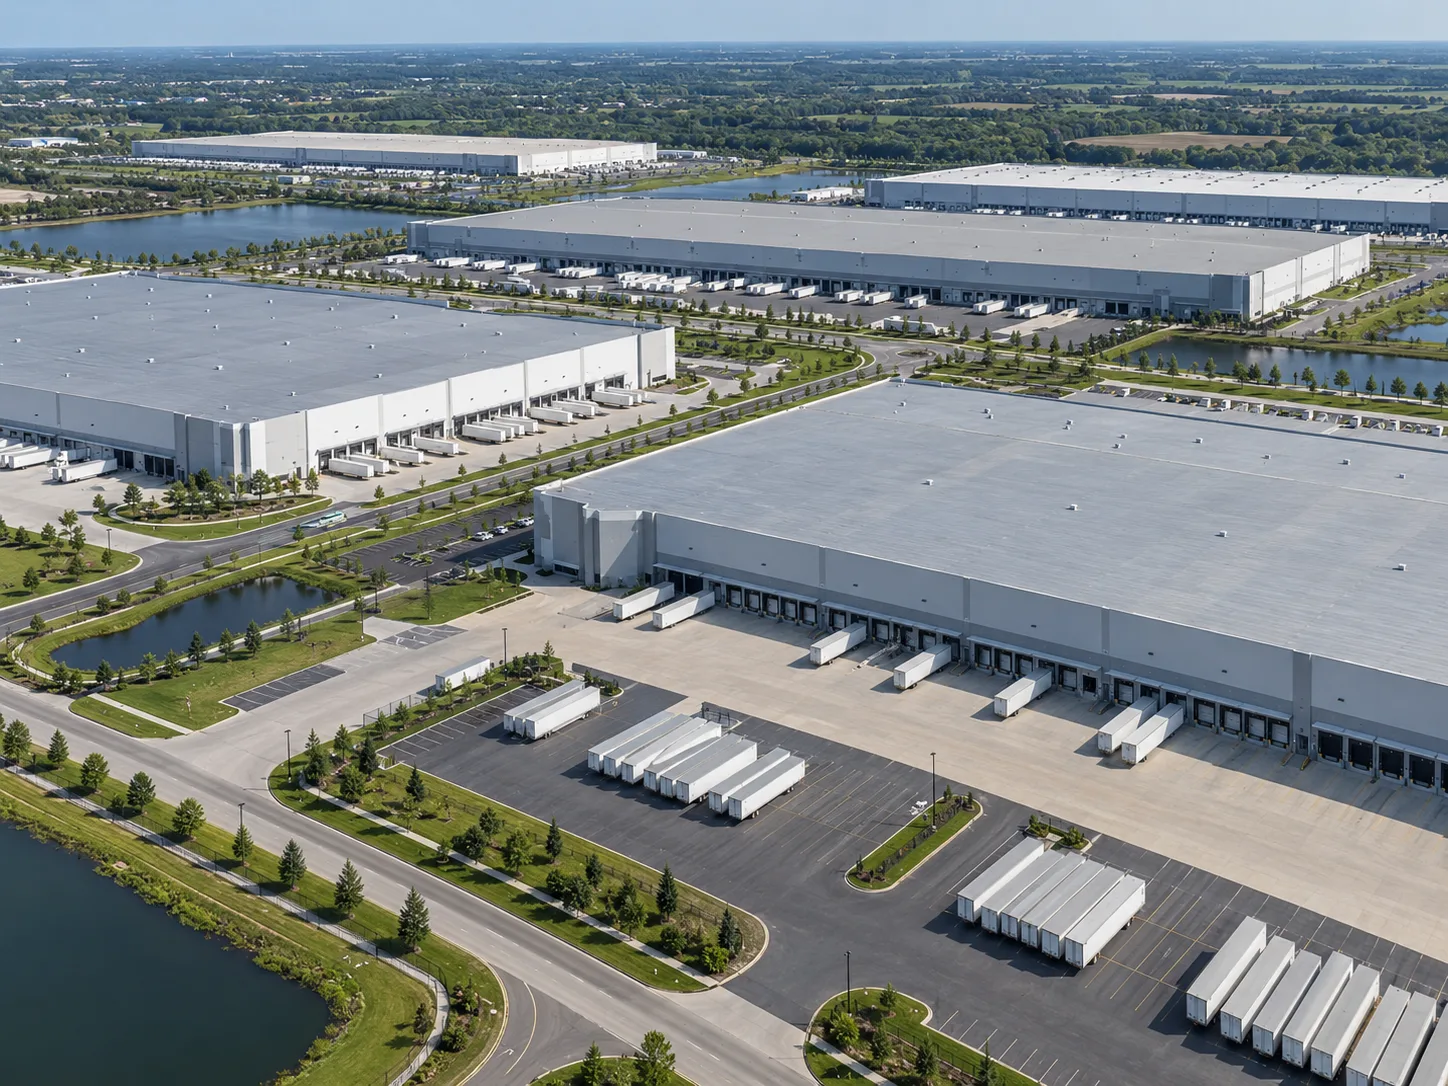
Industrial rents have softened recently without showing a broad contraction. CompStak’s low annual threshold for industrial is still positive at 1.5%.
As a result, a low-tier industrial market can still be recording rent growth. The median annual growth rate across industrial MSA-quarter observations was 6.38%, according to CompStak.
New York illustrates the distinction. It fell into the bottom industrial tier despite mildly positive annual rent growth because the sector’s historical thresholds remain elevated.
About one-quarter of industrial MSAs fell in the middle tier. The remaining markets were split roughly evenly between the high- and low-growth groups.
That distribution points to broad geographic dispersion rather than one national industrial trend. It also supports more conservative mark-to-market assumptions after several years of outsized gains.
Why It Matters
The data argues against using national rent growth as a complete underwriting signal. Annual gains can remain strong even after current leasing momentum turns weaker.
Retail requires extra caution because thin transaction coverage can amplify quarterly moves. Industrial needs different interpretation because even lower-tier growth may remain positive.
Office also remains highly local. CompStak’s market split shows that asset quality, tenant demand, concessions, and submarket conditions can matter more than national averages.
What’s Next
CompStak’s framework compares trailing-year growth with the latest quarter to identify cooling and rebounding markets. Investors can use that split to test whether backward-looking gains are strengthening or fading.
The latest reading suggests more normalization ahead rather than one uniform CRE rent cycle. Office, retail, and industrial are entering different phases at the same time.
Markets with weak annual results but stronger recent quarters can be rebounding. Strong annual markets with weaker recent readings can be cooling at the same time.