





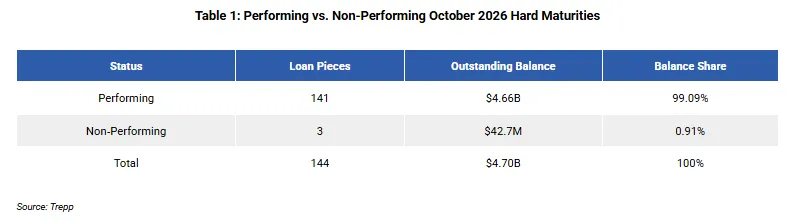
- October’s CMBS hard maturity cohort totals $4.70B across 144 loan pieces, up from $2.74B in September, and 99.09% of the balance is performing today.
- Two current SASB loans, a $569.2M multifamily portfolio and a $302.2M Honolulu resort, account for 66.79% of the balance carrying a debt yield below 6.0%.
- Office and retail dominate special servicing ahead of maturity, so refinance pressure is spread across property types rather than concentrated in one sector as in prior months.
The October 2026 CMBS hard maturity cohort totals $4.70B across 144 loan pieces, up from $2.74B in September, according to Trepp. The 144 pieces represent 118 whole loans.
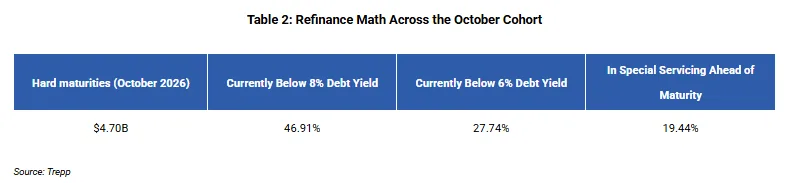
The balance carrying a debt yield below 6.0% held roughly steady at 27.74%, but the risk now sits in a different place.
Get Smarter about what matters in CRE
Stay ahead of trends in commercial real estate with CRE Daily – the free newsletter delivering everything you need to start your day in just 5-minutes
Two Loans Drive the Impairment
A national multifamily portfolio and a Honolulu resort account for 66.79% of the severely impaired balance. Both are single-asset, single-borrower loans.
Of the $1.30B maturing with a debt yield below 6.0%, 97.00% is currently performing.
The multifamily loan is a 2021-vintage portfolio. It has a 5.87% debt yield and $569.2M outstanding.
Meanwhile, the Honolulu resort loan totals $302.2M. It has a 5.52% debt yield. Neither loan is in special servicing.
Sector Mix Flips Again
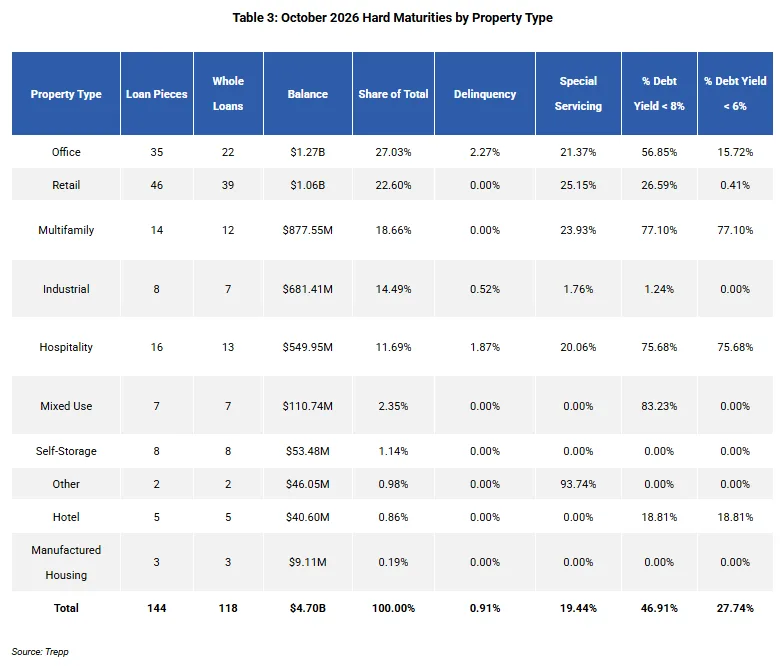
Office makes up the largest share of the cohort at $1.27B, or 27.03%. Retail follows at $1.06B, while multifamily accounts for $877.55M.
Industrial adds $681.41M. Hospitality accounts for another $549.95M.
Among loans with a debt yield below 6.0%, multifamily accounts for 51.86%. Hospitality follows at 31.90%.
By comparison, office accounts for 15.32% and retail just 0.33%. In September, retail led the group at 56.96%.
Multifamily is the starkest case. About 77.10% of its maturing balance sits below both the 8.0% and 6.0% debt yield thresholds.
Across the full cohort, 46.91% of the balance sits below an 8.0% debt yield. Meanwhile, industrial remains the cleanest sector. Just 1.24% of its balance sits below that line, while 1.76% is in special servicing.
Special Servicing Spreads Out
In total, 19.44% of the cohort balance is in special servicing ahead of maturity.
In September, office accounted for 74.94% of the special servicing balance. This month, that share fell to 29.71%.
Retail now accounts for 29.23%, while multifamily represents 22.96%.
Retail shows why the measures can differ. The sector has almost nothing below a 6.0% debt yield. Yet 25.15% of its maturing balance is in special servicing.
By contrast, office has 56.85% of its balance below an 8.0% debt yield. Only 15.72% sits below 6.0%. As a result, a paydown could still clear many of those loans.
Concentration Rises
The five largest maturities total $2.02B, or 43.03% of the cohort. That is up from 37.00% in September.
Three of the five are 2021-vintage floating-rate SASB loans. They are reaching the end of their extension options. All five remain current.
The three non-performing pieces are separate whole loans across three sectors. They include a $28.9M office loan, a $10.3M hospitality loan and a $3.5M industrial loan.
Non-performing balance fell to $42.7M from $98.7M. That equals 0.91% of the cohort, down from 3.60%.
Meanwhile, special servicing balance rose to $914.5M from $719.5M. However, its share of the total fell from 26.22%.
Why It Matters
Trepp’s broader hard maturity analysis puts 2026 maturities at $76.6B. That is more than either of the prior two years.
Of that total, 39% falls in Q4. In addition, 36% of those loans have a debt yield at or below 8%.
That segment faces the most refinancing friction. The pressure adds to the maturity wall in major markets.
It also adds to the multifamily distress lenders are already working through.
What’s Next
Trepp says the larger forward signal is the $1.27B of severely impaired maturing balance that remains current ahead of hard maturity.
Therefore, watch how the two large SASB loans resolve. Their outcomes will shape the October cohort’s results.