



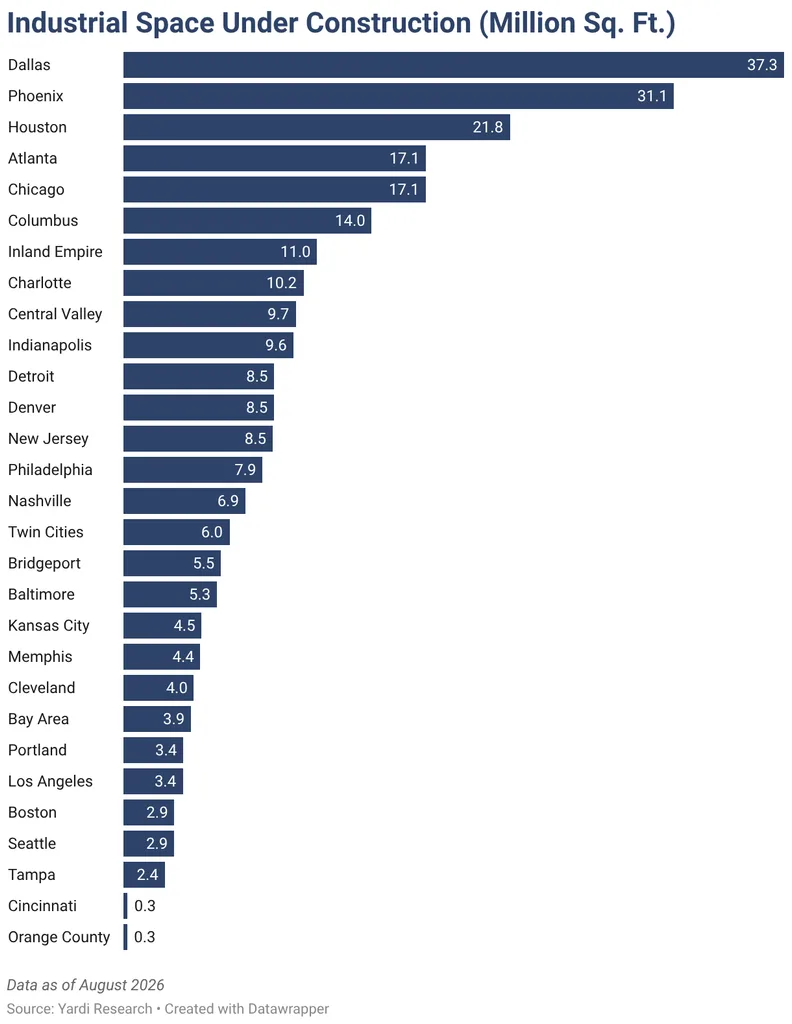
- The U.S. industrial pipeline reached nearly 447 million square feet in August 2026, up 32% from 338 million a year earlier and equal to about 2.1% of stock.
- Forty-nine buildings over 1 million square feet broke ground in the first eight months of 2026, accounting for more than 32% of starts, the highest share since 2020.
- With in-place rents up 5.4% and e-commerce reaching a record 20.2% of core retail, bulk demand is driving the sector’s shift from oversupply toward balance.
The U.S. industrial construction pipeline grew 32% year-over-year to nearly 447 million square feet in August, according to CommercialCafe’s national industrial report, which draws on Yardi Research data.
Bulk logistics projects are leading the charge, even as developers take a more disciplined approach to speculative building.
Get Smarter about what matters in CRE
Stay ahead of trends in commercial real estate with CRE Daily – the free newsletter delivering everything you need to start your day in just 5-minutes
From Glut to Growth
Between 2020 and 2022, developers started 1.5 billion square feet of industrial space, creating the largest oversupply in the sector’s history. Rising vacancies, slowing rent growth and higher capital and construction costs have since forced a pullback on speculative projects.
Demand has held up despite tariffs, economic uncertainty and higher energy prices, largely due to investment in supply chain resiliency. Peter Kolaczynski, director of Yardi Research, said the market is entering a growth phase after the early-2020s building boom and the absorption lag that followed.
The Details
The 447 million square feet under construction represents roughly 2.1% of stock. According to Yardi Matrix, 49 properties larger than 1 million square feet broke ground in the first eight months of 2026, up from 30 in all of 2024, putting the year on pace for the most million-plus starts since 2022.
Those mega-projects made up more than 32% of starts by square footage, the highest share since 2020. Charlotte’s pipeline grew 34.5% in August with the 1.57-million-square-foot Digital Charlotte Moores Chapel Road Building 2, while Baltimore’s under-construction total reached 5.3 million square feet, up 110% year-over-year.
Rents Rise as Vacancy Diverges
Average in-place rents reached $9.31 per square foot in August, up 5.4% year-over-year, while national vacancy held at 9.3%, up 60 basis points from August 2025. Atlanta led rent growth at 7.9%, followed by New Jersey and Miami at 7.6% each and Dallas at 7.5%.
Columbus vacancy fell 600 basis points to 7.5% and Indianapolis dropped 570 basis points to 5.5%, while Seattle climbed 500 basis points to 13.6% after delivering more than 44 million square feet since 2020. In the Midwest, warehouse labor growth has also cooled after a decade-long surge.
Regional Deal Flow
Phoenix logged $2.4 billion in industrial sales in August after a 27% month-over-month jump, averaging $163 per square foot, including Nuveen Real Estate’s $99.5 million purchase of Park303 Building A. Cincinnati sales surged 148% to $612 million at an average of $85 per square foot.
Tampa’s year-to-date volume doubled in a month to $1 billion, helped by TPG’s roughly $109 million buy of two Lakeland assets within a 53-building, 5.4-million-square-foot shallow-bay portfolio. In the Northeast, New Jersey topped $2 billion in year-to-date sales at about $182 per square foot, led by CBRE Investment’s $253 million deal for Building 8 at Exit 8A Distribution Center.
Pipelines keep swelling in some hubs. Chicago’s under-construction total reached 17 million square feet, and Philadelphia hit 7.9 million square feet, keeping its vacancy near 11%, up 320 basis points year-over-year.
Why It Matters
Investors are paying up. Year-to-date industrial sales reached $60.5 billion through August, up 40% annually, at an average of $138 per square foot. Los Angeles averaged $297 per square foot, up nearly 9%, and Netflix is under contract to buy the foreclosed Radford Studio Center for $400 million, or about $333 per square foot.
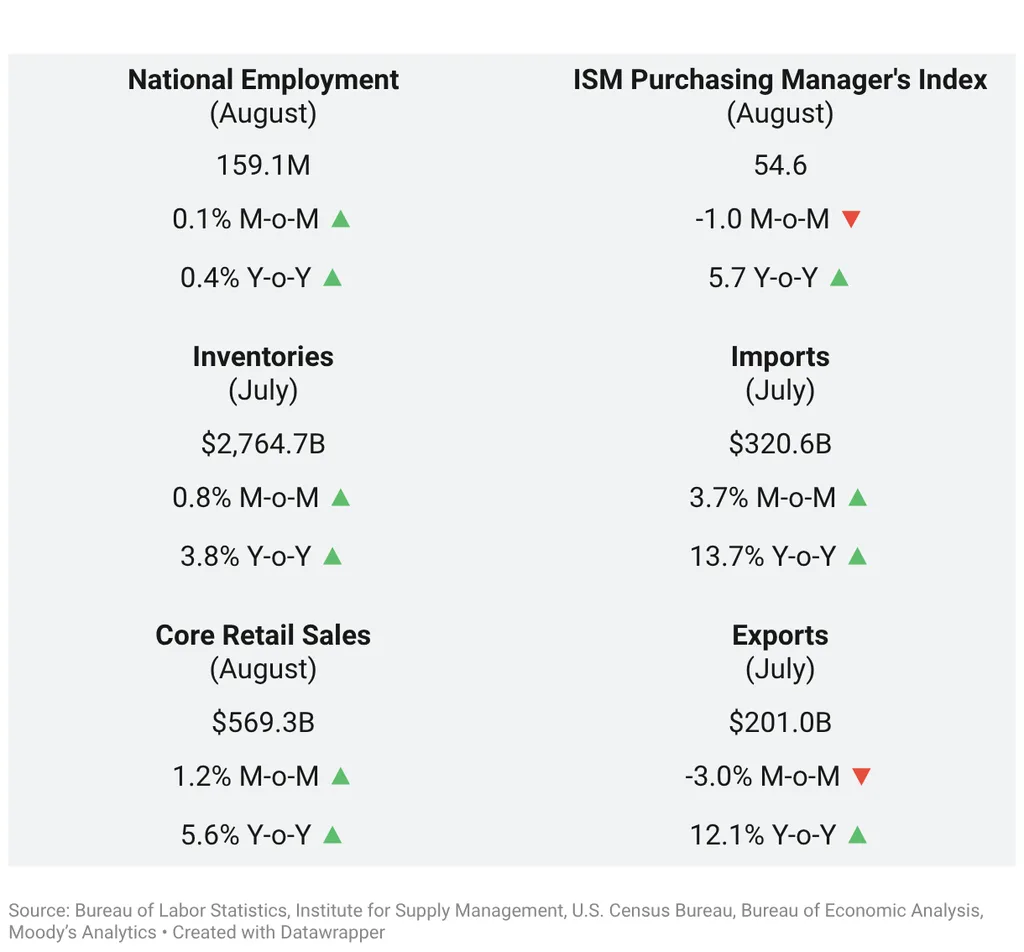
E-commerce remains the backbone of bulk demand. Online sales totaled $340.2 billion in Q2 2026, up 12.2% year-over-year and a record 20.2% of core retail sales, per U.S. Census Bureau data. Online sales need an estimated three times more logistics space than store sales, even as in-store spending holds up.
What’s Next
Seattle’s pipeline is thin, with only 1.1 million square feet started this year and 1.2 million planned, which could set up stronger absorption there. Sun Belt markets like Dallas, Phoenix, Atlanta and Houston have sustained rent growth despite heavy supply.
Markets tied to cross-border manufacturing or with the highest energy costs face the toughest road ahead, according to the report.