






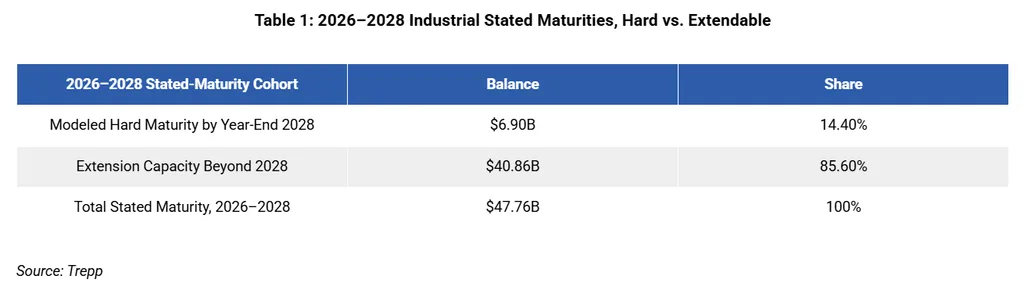
- Of $47.76B in industrial loans with stated maturities from 2026 through 2028, $40.86B has extension capacity beyond 2028.
- Only $6.9B reaches modeled hard maturity by year-end 2028, shifting much of the apparent maturity wall into 2029 through 2031.
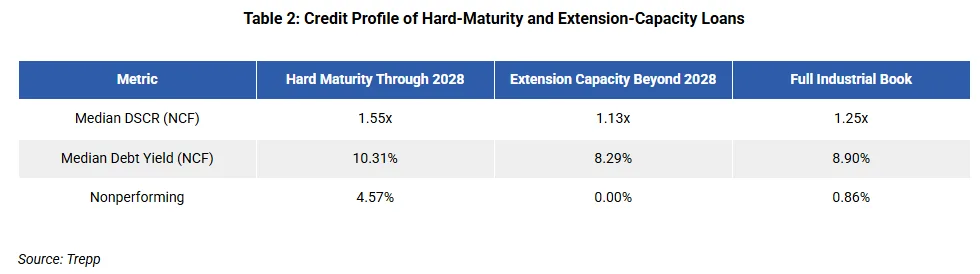
- Extension-eligible loans have a lower 1.13x median DSCR and remain exposed to floating-rate and hedging costs.
The near-term industrial maturity wall is smaller than stated loan dates suggest once contractual extensions are considered. Trepp’s analysis of securitized industrial debt found $47.76B of loans with stated maturities from 2026 through 2028. Only $6.9B of that group reaches modeled hard maturity by year-end 2028. The remaining $40.86B can potentially extend into later years.
Get Smarter about what matters in CRE
Stay ahead of trends in commercial real estate with CRE Daily – the free newsletter delivering everything you need to start your day in just 5-minutes
Stated Dates Overstate Near-Term Pressure
A stated maturity is the first date a borrower may need to repay, refinance, or exercise an extension. Hard maturity arrives only after contractual extension options are exhausted. A schedule based only on stated dates therefore overstates the amount that must be resolved by 2028. Trepp modeled fully extended maturities instead. The analysis does not assume borrowers will use every option. Exercise rights can depend on borrower elections and loan-specific conditions.
The Details
The $40.86B with extension capacity represents 85.6% of the $47.76B stated-maturity cohort. About $10.61B could shift to 2029. Another $16.83B can move to 2030, and $13.42B can reach 2031. On a fully extended basis, hard maturities total $4.75B in 2027 and $4.39B in 2028. They then rise to $16.38B in 2029, $21.67B in 2030, and $20.08B in 2031.
The Full Book Shows a Different Total
Trepp’s full industrial book contains $11.8B of modeled hard maturities from 2026 through 2028. That is higher than the $6.9B in the 2026-to-2028 stated-maturity cohort. The difference is $4.9B. Those loans had stated maturities before 2026, but their remaining extension periods expire during the current analysis window. The distinction is important when comparing tables or measuring the true refinancing schedule.
Two Measures Show Different Credit Risks
Trepp separates payment capacity from leverage risk. DSCR compares net cash flow with current debt service, so it shows whether property income covers scheduled payments. Debt yield divides net cash flow by the outstanding loan balance. It is independent of the loan’s interest rate and amortization. That makes debt yield useful for refinance analysis. The two measures show why a loan can have manageable current payments but still face a difficult refinancing outcome.
Extension Loans Carry Different Risk
The extension-capacity group has a 1.13x median DSCR. That is below the 1.25x median for the full industrial book. Its median debt yield is 8.29%, compared with 8.9% across the full book. Every loan in the extension-capacity cohort carries a floating rate. Debt service therefore remains sensitive to benchmarks and existing interest-rate caps. Borrowers may also need to buy replacement caps when they extend. By contrast, the hard-maturity cohort has a 1.55x median DSCR and 10.31% median debt yield.
Distress Is Concentrated
The hard-maturity group has a 4.57% nonperforming rate, versus 0.86% for the full industrial book. However, that represents only $315.5M across nine loans. The largest troubled loans show different causes. A $144.1M National Warehouse & Distribution Portfolio loan entered foreclosure despite a 1.73x DSCR and 14.42% debt yield. Servicing commentary pointed to borrower and collateral-control issues. A $94.3M Tryad Industrial & Business Center loan shows deeper property weakness. Its DSCR is 0.19x and debt yield is 1.40%.
Why It Matters
The distinction between stated and hard maturities changes the timing of CMBS refinancing pressure for industrial borrowers. Most near-term debt has contractual runway. The sector therefore does not face a single $47.76B resolution event by 2028. The risk is delayed rather than eliminated. Many extension-eligible loans have thinner coverage and floating-rate exposure. Refinance pressure can therefore accumulate in 2029 through 2031.
What’s Next
The modeled maturity peak moves to 2030 under the fully extended schedule. Borrower decisions, extension conditions, benchmark rates, and hedging costs will shape the actual timeline. Some loans may repay before their final extension dates. Others may use all available options. The key credit question is when extension capacity expires and refinancing becomes unavoidable. Extension decisions may also depend on the cost of replacement interest-rate caps, adding another expense before borrowers can push maturities outward.